
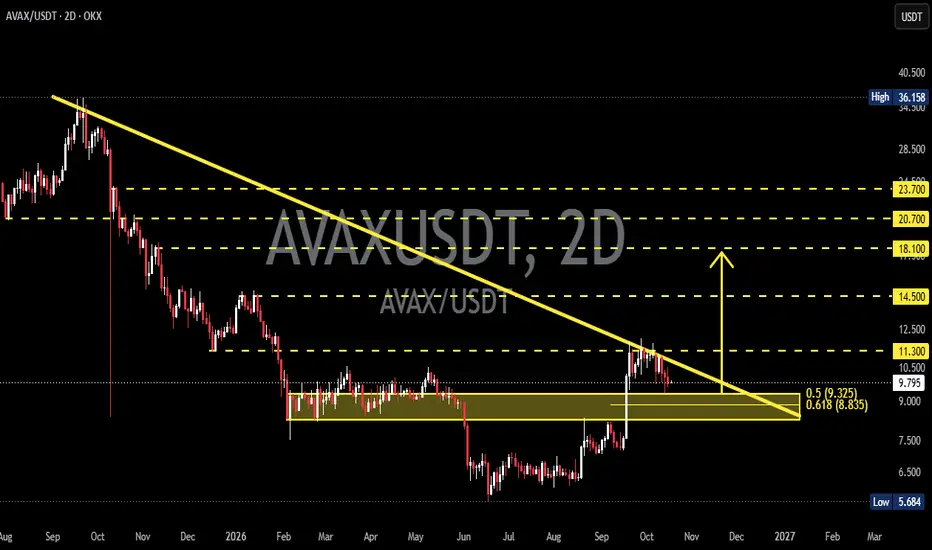
AVAX continues to trade below a Descending Trendline, indicating that the medium-term downtrend remains a major challenge for buyers. This trendline has repeatedly limited price movements and could continue to act as dynamic resistance.
However, after forming a low around $5.68, the price began to recover and climbed toward $11.30 before facing renewed selling pressure.
This development opens the possibility of a momentum shift, although confirmation of a trend reversal is still needed.
🟨 Key Support Zone: $8.30–$9.30
The yellow block represents an important support area that previously served as a price consolidation zone between February and May. This area could attract renewed buying interest if the price experiences a pullback.
AVAX is currently trading around $9.77, making a retest of the $8.30–$9.30 zone one of the key scenarios to watch before a potential continuation to the upside.
If the price retests this zone and holds above it, accompanied by a strong bullish reaction, the probability of a rebound could increase. Conversely, a decisive break below support could open the door to further downside.
## 🟢 Bullish Scenario
AVAX could extend its recovery if the $8.30–$9.30 support zone holds.
📌 Key developments to watch:
1. Price pulls back toward the $8.30–$9.30 support block.
2. Buyers defend the zone and generate a bullish reaction.
3. Price moves higher again and breaks above the $11.30 resistance.
4. A breakout above the Descending Trendline strengthens the potential for a trend reversal.
🎯 Potential upside targets:
- $11.30 — Immediate resistance.
- $14.50 — Next resistance target.
- $18.10 — Further upside target if bullish momentum strengthens.
- $20.70–$23.70 — Higher resistance zone in a stronger recovery scenario.
⚠️ These targets represent potential price levels, not guaranteed outcomes. Breakout confirmation and trading volume should be monitored closely.
## 🔴 Bearish Scenario
Bearish risks remain as long as the price fails to break above and sustain its position beyond the Descending Trendline.
📌 Key developments to watch:
1. Price fails to break above the dynamic resistance of the Descending Trendline.
2. Selling pressure increases, pushing the price back toward $9.30.
3. Price breaks below the $8.30–$9.30 support block.
4. If a confirmed breakdown occurs, the former support zone could turn into resistance.
🎯 Potential downside levels:
- $8.30 — Lower boundary of the support block.
- $7.50 — Historical price area to monitor.
- $6.50 — Consolidation area before the previous decline.
- $5.68 — Major swing low on the chart.
A 2D candle close below $8.30, particularly if accompanied by increasing selling volume, would strengthen the risk of further downside.
## 🔍 Conclusion
AVAX is approaching a critical phase after recovering from its low near $5.68. Although the price has rallied toward $11.30, the Descending Trendline remains a major obstacle to a stronger trend reversal.
💡 The primary scenario to watch is a retest of the $8.30–$9.30 support zone before the next potential upward move.
If support holds and the price regains bullish momentum, AVAX could retest $11.30, followed by $14.50 and $18.10.
However, if support breaks down, the bullish scenario would weaken, and a retest of lower price levels would become a risk to consider.
⏳ Confirmation remains key. Monitor the price reaction within the yellow support block, a potential breakout above the Descending Trendline, and trading volume before making any trading decisions.
⚠️ This analysis is for educational purposes only and does not constitute financial advice. Always conduct your own research (DYOR) and manage your risk responsibly.
#AVAX #AVAXUSDT #Avalanche
However, after forming a low around $5.68, the price began to recover and climbed toward $11.30 before facing renewed selling pressure.
This development opens the possibility of a momentum shift, although confirmation of a trend reversal is still needed.
🟨 Key Support Zone: $8.30–$9.30
The yellow block represents an important support area that previously served as a price consolidation zone between February and May. This area could attract renewed buying interest if the price experiences a pullback.
AVAX is currently trading around $9.77, making a retest of the $8.30–$9.30 zone one of the key scenarios to watch before a potential continuation to the upside.
If the price retests this zone and holds above it, accompanied by a strong bullish reaction, the probability of a rebound could increase. Conversely, a decisive break below support could open the door to further downside.
## 🟢 Bullish Scenario
AVAX could extend its recovery if the $8.30–$9.30 support zone holds.
📌 Key developments to watch:
1. Price pulls back toward the $8.30–$9.30 support block.
2. Buyers defend the zone and generate a bullish reaction.
3. Price moves higher again and breaks above the $11.30 resistance.
4. A breakout above the Descending Trendline strengthens the potential for a trend reversal.
🎯 Potential upside targets:
- $11.30 — Immediate resistance.
- $14.50 — Next resistance target.
- $18.10 — Further upside target if bullish momentum strengthens.
- $20.70–$23.70 — Higher resistance zone in a stronger recovery scenario.
⚠️ These targets represent potential price levels, not guaranteed outcomes. Breakout confirmation and trading volume should be monitored closely.
## 🔴 Bearish Scenario
Bearish risks remain as long as the price fails to break above and sustain its position beyond the Descending Trendline.
📌 Key developments to watch:
1. Price fails to break above the dynamic resistance of the Descending Trendline.
2. Selling pressure increases, pushing the price back toward $9.30.
3. Price breaks below the $8.30–$9.30 support block.
4. If a confirmed breakdown occurs, the former support zone could turn into resistance.
🎯 Potential downside levels:
- $8.30 — Lower boundary of the support block.
- $7.50 — Historical price area to monitor.
- $6.50 — Consolidation area before the previous decline.
- $5.68 — Major swing low on the chart.
A 2D candle close below $8.30, particularly if accompanied by increasing selling volume, would strengthen the risk of further downside.
## 🔍 Conclusion
AVAX is approaching a critical phase after recovering from its low near $5.68. Although the price has rallied toward $11.30, the Descending Trendline remains a major obstacle to a stronger trend reversal.
💡 The primary scenario to watch is a retest of the $8.30–$9.30 support zone before the next potential upward move.
If support holds and the price regains bullish momentum, AVAX could retest $11.30, followed by $14.50 and $18.10.
However, if support breaks down, the bullish scenario would weaken, and a retest of lower price levels would become a risk to consider.
⏳ Confirmation remains key. Monitor the price reaction within the yellow support block, a potential breakout above the Descending Trendline, and trading volume before making any trading decisions.
⚠️ This analysis is for educational purposes only and does not constitute financial advice. Always conduct your own research (DYOR) and manage your risk responsibly.
#AVAX #AVAXUSDT #Avalanche

✅ Get Free Signals! Join Our Telegram Channel Here: t.me/TheCryptoNuclear
✅ Twitter: twitter.com/crypto_nuclear
✅ Join Bybit : partner.bybit.com/b/nuclearvip
✅ Benefits : Lifetime Trading Fee Discount -50%
✅ Twitter: twitter.com/crypto_nuclear
✅ Join Bybit : partner.bybit.com/b/nuclearvip
✅ Benefits : Lifetime Trading Fee Discount -50%
Exención de responsabilidad
La información y las publicaciones no constituyen, ni deben considerarse como, asesoramiento o recomendaciones financieras, de inversión, de trading u otro tipo, proporcionadas o respaldadas por TradingView. Obtenga más información en Condiciones de uso.
✅ Get Free Signals! Join Our Telegram Channel Here: t.me/TheCryptoNuclear
✅ Twitter: twitter.com/crypto_nuclear
✅ Join Bybit : partner.bybit.com/b/nuclearvip
✅ Benefits : Lifetime Trading Fee Discount -50%
✅ Twitter: twitter.com/crypto_nuclear
✅ Join Bybit : partner.bybit.com/b/nuclearvip
✅ Benefits : Lifetime Trading Fee Discount -50%
Exención de responsabilidad
La información y las publicaciones no constituyen, ni deben considerarse como, asesoramiento o recomendaciones financieras, de inversión, de trading u otro tipo, proporcionadas o respaldadas por TradingView. Obtenga más información en Condiciones de uso.