
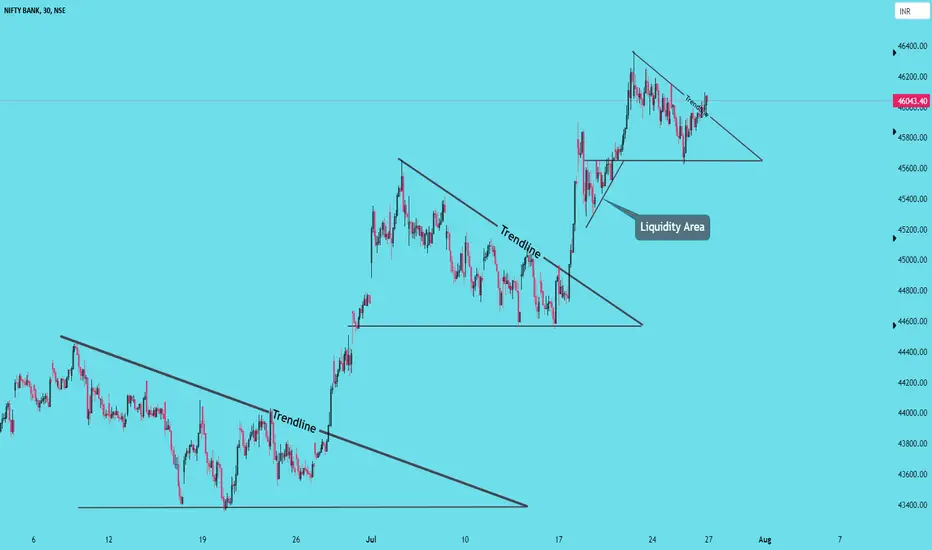
If we look at the chart price breaking the trendline and moving super bullish...
after breaking the trendline price moving like a rocket.
Today after breaking the trendline price is not moving much points....
it's slowly moving to the upside..
Case 1::
What happens if price not able to move upside::
If tomorrow price opens gap up and it has to move upside, if its bullish again.

Case2 :: If price opens gap down its clearly indicating bearish sign.
sellers will immediately take the price downwards...so no more bullishness in the market.
consider end of bullishness.
If tomorrow price falls below the trendline again...
we will wait for the perfect place to enter for short again.
by keeping the stop loss above the previous strong fall high.
targets up to the Demand and bullish gap point only.

If price breaks the 45600 level,
we will notice a strong fall happens up to 45200 area where there is more liquidity, to eliminate all the buy orders.
After a strong fall from the area 46100 level, today again price comes back to the same level..
To test the supply zone price is moving in a bullish channel...
so until price breaks this and retest will not go for short side....

Note ::
some times price opens up or down and fills the gap and continue fall or rise again...so be cautious in such cases.
will see what happens in the next session.
Disclaimer - All information on this page is for educational purposes only,
we are not SEBI Registered.
after breaking the trendline price moving like a rocket.
Today after breaking the trendline price is not moving much points....
it's slowly moving to the upside..
Case 1::
What happens if price not able to move upside::
If tomorrow price opens gap up and it has to move upside, if its bullish again.
Case2 :: If price opens gap down its clearly indicating bearish sign.
sellers will immediately take the price downwards...so no more bullishness in the market.
consider end of bullishness.
If tomorrow price falls below the trendline again...
we will wait for the perfect place to enter for short again.
by keeping the stop loss above the previous strong fall high.
targets up to the Demand and bullish gap point only.
If price breaks the 45600 level,
we will notice a strong fall happens up to 45200 area where there is more liquidity, to eliminate all the buy orders.
After a strong fall from the area 46100 level, today again price comes back to the same level..
To test the supply zone price is moving in a bullish channel...
so until price breaks this and retest will not go for short side....
Note ::
some times price opens up or down and fills the gap and continue fall or rise again...so be cautious in such cases.
will see what happens in the next session.
Disclaimer - All information on this page is for educational purposes only,
we are not SEBI Registered.
Nota
Price exactly opens at Near ATH, will wait for before entering long...don't go for buying immediately.
price may falls rapidly...keep watch.
Nota
wait for the short side...if price falls below this level and gives us retest we will initiate short.Nota
Keep in mind 2 points, after break of trendline gap up occured...if this is initiated by buyers after filling the gap it has to move in the same direction...
If price unable to move upside...indicating that buyers are closed their positions...
wait until Gap finished.
Nota
price consolidating and moving up...sign of reversal. wait for more confirmation.Nota
If price not able to go upside...and again falls below the channel, will look for short entry. until wait.Nota
with small risk we can enter on put side...Nota
Don't go short...it will gives us retracement...just broken the level.Nota
without giving entry price touches the gap point...wait for the retracement.Nota
Price broken the zone strongly....wait for retest...to enter short side...Nota
I entered on sell side...here.. still its pending..for target...after a strong fall..its risky to share.Nota
Price is consolidating at the same place...if demand breaks will get some points.until no long entry.
Nota
Operación cerrada manualmente
Nota
one position exited.Operación cerrada: objetivo alcanzado
Target1 done finally.Operación cerrada manualmente
Nota
WIll see in the next session what happens.
Publicaciones relacionadas
Exención de responsabilidad
La información y las publicaciones no constituyen, ni deben considerarse como, asesoramiento o recomendaciones financieras, de inversión, de trading u otro tipo, proporcionadas o respaldadas por TradingView. Obtenga más información en Condiciones de uso.
Publicaciones relacionadas
Exención de responsabilidad
La información y las publicaciones no constituyen, ni deben considerarse como, asesoramiento o recomendaciones financieras, de inversión, de trading u otro tipo, proporcionadas o respaldadas por TradingView. Obtenga más información en Condiciones de uso.