
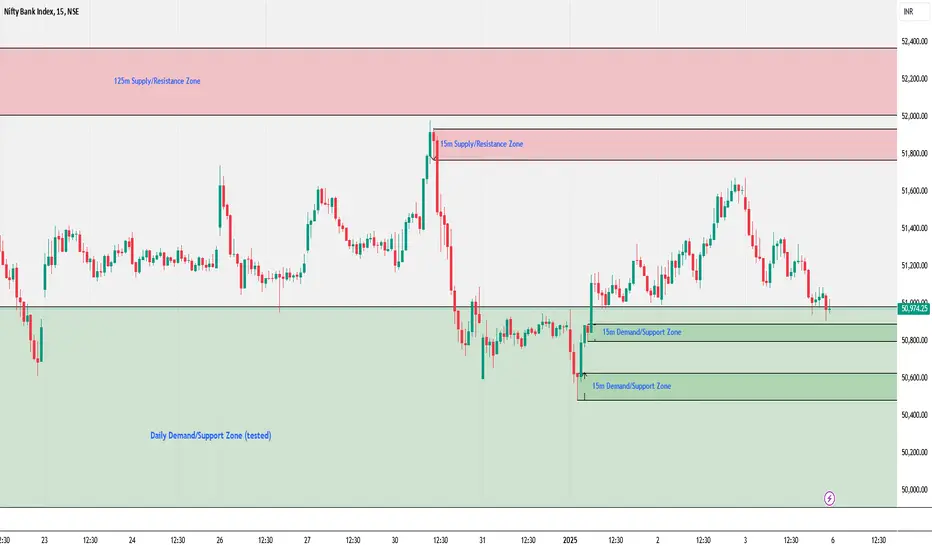
On Friday, BankNifty opened flat to negative, reaching a high of 51,671.60 before facing intense selling pressure. The index failed to hold at the 15-minute demand zone, dropping sharply to a low of 50,904.35. It eventually closed at 50,988.80, losing 616 points over the previous close. The Weekly Trend (50 SMA) is sideways, while the Daily Trend (50 SMA) remains negative.
Demand/Support Zones
Near Minor Demand/Support Zone (15m): 50,800.50 - 50,890
Near Demand/Support Zone (15m): 50,485.05 - 50,629.65
Far Demand/Support Zone (Daily): 49,787.10 - 50,983.50 (tested)
Far Support Level: 49,282.64 (61.8% FIBO retracement)
Supply/Resistance Zones
Near Supply/Resistance Zone (15m): 51,767.65 - 51,937.05
Near Supply/Resistance Zone (125m): 52,010.65 - 52,368.30
Far Supply/Resistance Zone (125m): 52,709.40 - 52,911.10
Far Supply/Resistance Zone (Weekly): 53,741.40 - 54,467.35 (tested)
Demand/Support Zones
Near Minor Demand/Support Zone (15m): 50,800.50 - 50,890
Near Demand/Support Zone (15m): 50,485.05 - 50,629.65
Far Demand/Support Zone (Daily): 49,787.10 - 50,983.50 (tested)
Far Support Level: 49,282.64 (61.8% FIBO retracement)
Supply/Resistance Zones
Near Supply/Resistance Zone (15m): 51,767.65 - 51,937.05
Near Supply/Resistance Zone (125m): 52,010.65 - 52,368.30
Far Supply/Resistance Zone (125m): 52,709.40 - 52,911.10
Far Supply/Resistance Zone (Weekly): 53,741.40 - 54,467.35 (tested)

Publicaciones relacionadas
Exención de responsabilidad
La información y las publicaciones no constituyen, ni deben considerarse como, asesoramiento o recomendaciones financieras, de inversión, de trading u otro tipo, proporcionadas o respaldadas por TradingView. Obtenga más información en Condiciones de uso.
Publicaciones relacionadas
Exención de responsabilidad
La información y las publicaciones no constituyen, ni deben considerarse como, asesoramiento o recomendaciones financieras, de inversión, de trading u otro tipo, proporcionadas o respaldadas por TradingView. Obtenga más información en Condiciones de uso.