
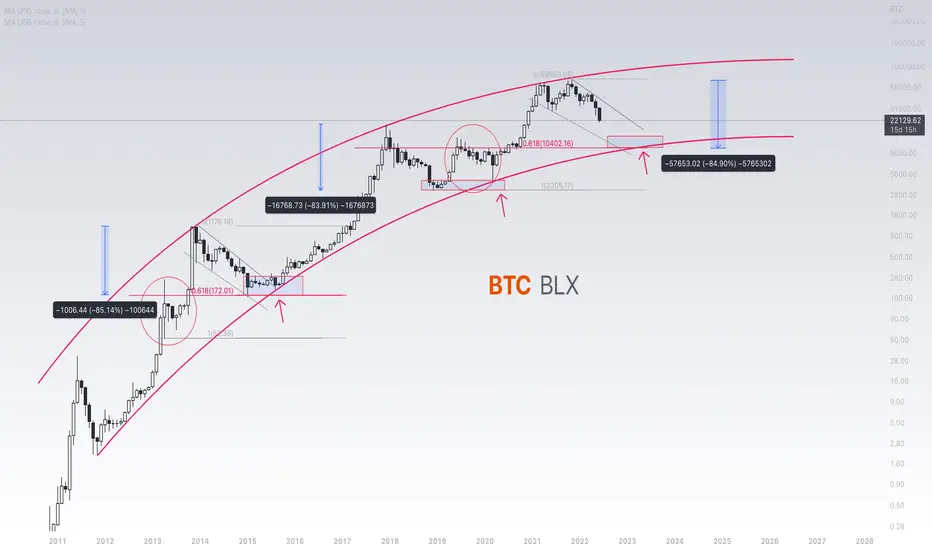
Here's a scenario to look at. I know the curved lines are subjective, but look at the circled part of the chart and the PA that followed after. Im referring to 2013 -2015
We've already seen ETH drop below it's previous ATH and we may see something similar for BTC with a touch of the macro 0.618 fib at around 10k. The 0.5 fib is around 14k so im speculating on a price within this range.
10k would also equate to a 84% drop which has been the trend for BTC whenever it hits its top in the previous 2x
Let's see how this goes
We've already seen ETH drop below it's previous ATH and we may see something similar for BTC with a touch of the macro 0.618 fib at around 10k. The 0.5 fib is around 14k so im speculating on a price within this range.
10k would also equate to a 84% drop which has been the trend for BTC whenever it hits its top in the previous 2x
Let's see how this goes

Exención de responsabilidad
La información y las publicaciones no constituyen, ni deben considerarse como, asesoramiento o recomendaciones financieras, de inversión, de trading u otro tipo, proporcionadas o respaldadas por TradingView. Obtenga más información en Condiciones de uso.
Exención de responsabilidad
La información y las publicaciones no constituyen, ni deben considerarse como, asesoramiento o recomendaciones financieras, de inversión, de trading u otro tipo, proporcionadas o respaldadas por TradingView. Obtenga más información en Condiciones de uso.