
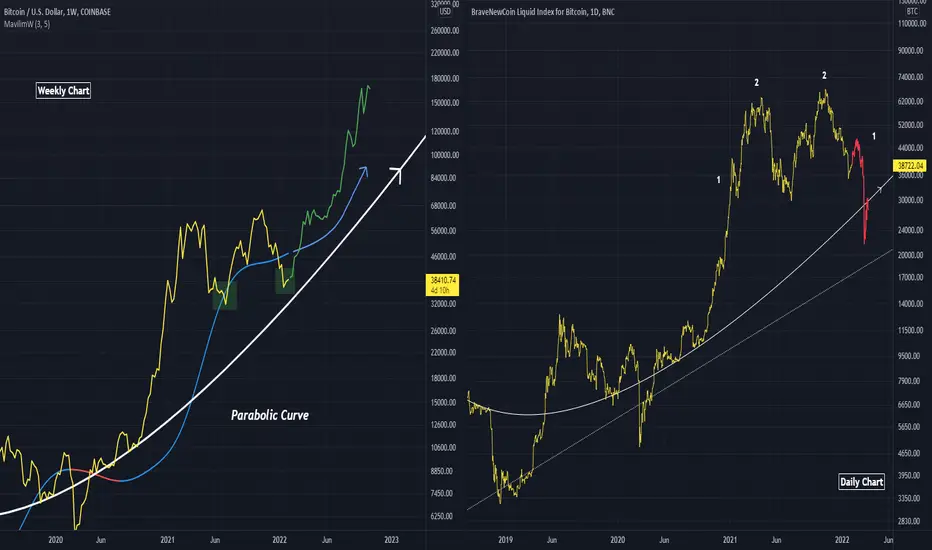
On the left I assume the Parabolic trend hodls, coupled with a double bottom , leading to price increase on the Weekly timeframe
On the right I assume a third breakdown under the same Parabolic trend occurs, as indicated by (1). This provides symmetry for the current formation and allows for the third dip.
Red pill, blue pill
On the right I assume a third breakdown under the same Parabolic trend occurs, as indicated by (1). This provides symmetry for the current formation and allows for the third dip.
Red pill, blue pill
Nota
The suggested peak (bars pattern) on the bull chart could just be the initial spike on the (1) move for the bears
Exención de responsabilidad
La información y las publicaciones no constituyen, ni deben considerarse como, asesoramiento o recomendaciones financieras, de inversión, de trading u otro tipo, proporcionadas o respaldadas por TradingView. Obtenga más información en Condiciones de uso.
Exención de responsabilidad
La información y las publicaciones no constituyen, ni deben considerarse como, asesoramiento o recomendaciones financieras, de inversión, de trading u otro tipo, proporcionadas o respaldadas por TradingView. Obtenga más información en Condiciones de uso.