
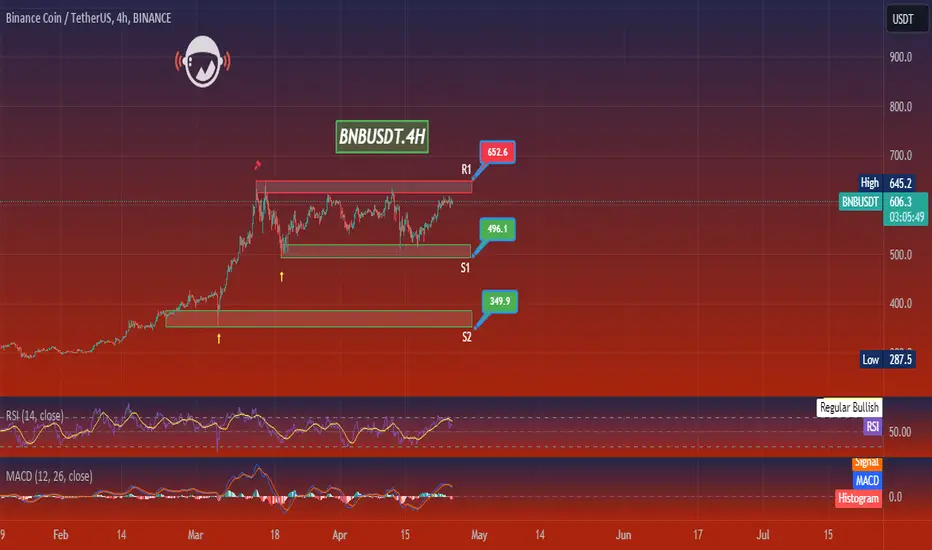
In the 4-hour chart for Binance Coin (BNB/USDT), BNB is trading within a range, with price action fluctuating between support and resistance levels. The resistance (R1) at $652.6 represents the upper boundary of the range, while the support (S1) at $496.1 acts as the lower boundary. There's an additional support level (S2) at $349.9, marked by earlier price interactions.
The current price is at $606.1. The RSI is at a neutral 58.56, suggesting that there's room for movement in either direction without being in the overbought or oversold territory. The MACD is hovering around the signal line, indicating a balance between buyers and sellers with no clear momentum.
For traders, watching for a breakout above R1 could provide a bullish signal, while a break below S1 might suggest bearish momentum. The strategy could involve entering trades following a bounce from S1 or a breakout above R1, with appropriate risk management measures such as stop-loss orders. Confirmation from trading volume would strengthen the signal for entry.
The current price is at $606.1. The RSI is at a neutral 58.56, suggesting that there's room for movement in either direction without being in the overbought or oversold territory. The MACD is hovering around the signal line, indicating a balance between buyers and sellers with no clear momentum.
For traders, watching for a breakout above R1 could provide a bullish signal, while a break below S1 might suggest bearish momentum. The strategy could involve entering trades following a bounce from S1 or a breakout above R1, with appropriate risk management measures such as stop-loss orders. Confirmation from trading volume would strengthen the signal for entry.

Exención de responsabilidad
La información y las publicaciones no constituyen, ni deben considerarse como, asesoramiento o recomendaciones financieras, de inversión, de trading u otro tipo, proporcionadas o respaldadas por TradingView. Obtenga más información en Condiciones de uso.
Exención de responsabilidad
La información y las publicaciones no constituyen, ni deben considerarse como, asesoramiento o recomendaciones financieras, de inversión, de trading u otro tipo, proporcionadas o respaldadas por TradingView. Obtenga más información en Condiciones de uso.