
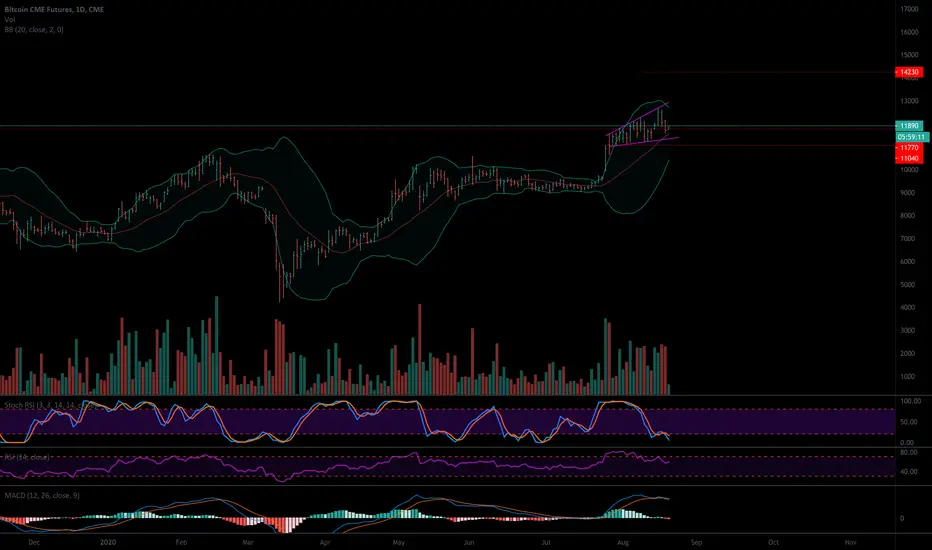
Based on the ascending broadening wedge formed on the CME chart, Bitcoin has a 52% to break down to approx. $11K. However, that means that it has a 48% chance to break to approx. $14K. What do you think? MACD is indicating a break lower. However, here is the good news! These patterns don't typically form in bear markets! They form in BULL markets, so that's interesting evidence pointing to a bull market in Bitcoin! I am LONG, long-term! LET'S GO BULLS! :-)

Exención de responsabilidad
La información y las publicaciones no constituyen, ni deben considerarse como, asesoramiento o recomendaciones financieras, de inversión, de trading u otro tipo, proporcionadas o respaldadas por TradingView. Obtenga más información en Condiciones de uso.
Exención de responsabilidad
La información y las publicaciones no constituyen, ni deben considerarse como, asesoramiento o recomendaciones financieras, de inversión, de trading u otro tipo, proporcionadas o respaldadas por TradingView. Obtenga más información en Condiciones de uso.