
Hello
It's a Bitcoin Guide.
My analysis is optimized for TradingView.
If you press the Replay button, you can check real-time movements.

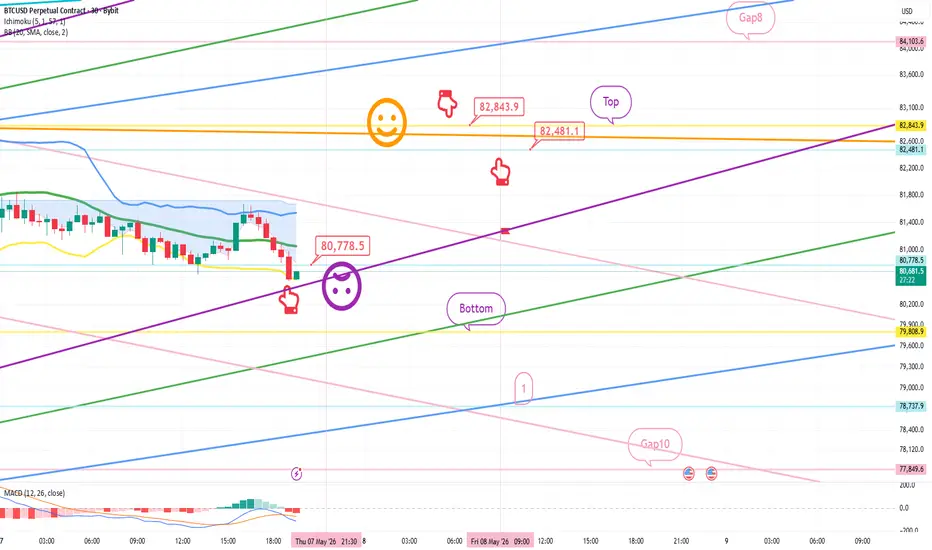
This is the Bitcoin 30-minute chart.
The Nasdaq indicators will be released shortly at 9:30.
A MACD Dead Cross is currently in progress on the 6-hour chart.
Additionally, it appears that today's direction will be determined at the Gap 8 zone formed in January at the top, and the Gap 10 zone formed last week at the bottom.
*Long Position Strategy (Following the red finger movement path)
1) Buy on the 80778.5 dollar mark / Stop loss if the purple support line is broken or the Bottom is touched.
2) 82843.9 dollar Long Position 1st Target -> Gap 8 2nd Target
If the purple support line is broken, the Bottom zone at the bottom opens up to Zone 1.
(Mid-term pattern broken)
If it reaches Zone 1, the probability of a Gap 10 retracement becomes very high.
From the perspective of a long position, it would be best to maintain the purple support line, right?
Please use my analysis merely as a reference and for practical purposes.
I hope you operate safely by adhering to trading principles and strictly using stop-loss orders.
Thank you.
It's a Bitcoin Guide.
My analysis is optimized for TradingView.
If you press the Replay button, you can check real-time movements.
This is the Bitcoin 30-minute chart.
The Nasdaq indicators will be released shortly at 9:30.
A MACD Dead Cross is currently in progress on the 6-hour chart.
Additionally, it appears that today's direction will be determined at the Gap 8 zone formed in January at the top, and the Gap 10 zone formed last week at the bottom.
*Long Position Strategy (Following the red finger movement path)
1) Buy on the 80778.5 dollar mark / Stop loss if the purple support line is broken or the Bottom is touched.
2) 82843.9 dollar Long Position 1st Target -> Gap 8 2nd Target
If the purple support line is broken, the Bottom zone at the bottom opens up to Zone 1.
(Mid-term pattern broken)
If it reaches Zone 1, the probability of a Gap 10 retracement becomes very high.
From the perspective of a long position, it would be best to maintain the purple support line, right?
Please use my analysis merely as a reference and for practical purposes.
I hope you operate safely by adhering to trading principles and strictly using stop-loss orders.
Thank you.
Operación cerrada: precio stop alcanzado
Hello.This is the Bitcoin Guide.
Let's check the movements since the analysis post was written on May 7th.
This is the Bitcoin 30-minute chart.
I have marked the key zones with a black finger.
Regarding the long position strategy indicated by the red finger,
after entering a long position at $80,778.5,
the strategy was executed as a stop loss upon breaking the purple support line.
It touched the bottom zone and continues to undergo corrections.
Please pay attention to Zone 1 at the bottom.
Regarding the Gap 10 zone at the very bottom,
a retracement occurred this past Monday, May 4th, at 10:30 AM with a strong lower wick rebound.
It seems there was a mistake in the check; you may delete this part.
In addition, since the price broke below the purple support line due to yesterday's movement, the mid-term pattern has been broken, and a MACD death cross is currently in progress on the 12-hour and daily charts in real-time.
Because Bitcoin has the fastest turnover rate, it continues to decline compared to the Nasdaq or Gold.
I will proceed with today's strategy right away.
Thank you.

[Bitcoin Guide Affiliate]
*Bybit 20%DC Lifetime + $30,100
partner.bybit.com/b/Bitcoin_Guide
*BingX 50%DC + $14,100
bit.ly/3E8ZkAW
*ZeroMarket ECN 40%DC
bit.ly/3pY0dUv
*Telegram
t.me/bitcoinguide_TM
*Bybit 20%DC Lifetime + $30,100
partner.bybit.com/b/Bitcoin_Guide
*BingX 50%DC + $14,100
bit.ly/3E8ZkAW
*ZeroMarket ECN 40%DC
bit.ly/3pY0dUv
*Telegram
t.me/bitcoinguide_TM
Publicaciones relacionadas
Exención de responsabilidad
La información y las publicaciones no constituyen, ni deben considerarse como, asesoramiento o recomendaciones financieras, de inversión, de trading u otro tipo, proporcionadas o respaldadas por TradingView. Obtenga más información en Condiciones de uso.
[Bitcoin Guide Affiliate]
*Bybit 20%DC Lifetime + $30,100
partner.bybit.com/b/Bitcoin_Guide
*BingX 50%DC + $14,100
bit.ly/3E8ZkAW
*ZeroMarket ECN 40%DC
bit.ly/3pY0dUv
*Telegram
t.me/bitcoinguide_TM
*Bybit 20%DC Lifetime + $30,100
partner.bybit.com/b/Bitcoin_Guide
*BingX 50%DC + $14,100
bit.ly/3E8ZkAW
*ZeroMarket ECN 40%DC
bit.ly/3pY0dUv
*Telegram
t.me/bitcoinguide_TM
Publicaciones relacionadas
Exención de responsabilidad
La información y las publicaciones no constituyen, ni deben considerarse como, asesoramiento o recomendaciones financieras, de inversión, de trading u otro tipo, proporcionadas o respaldadas por TradingView. Obtenga más información en Condiciones de uso.