
Bitcoin technical analysis update (Weekly Chart)
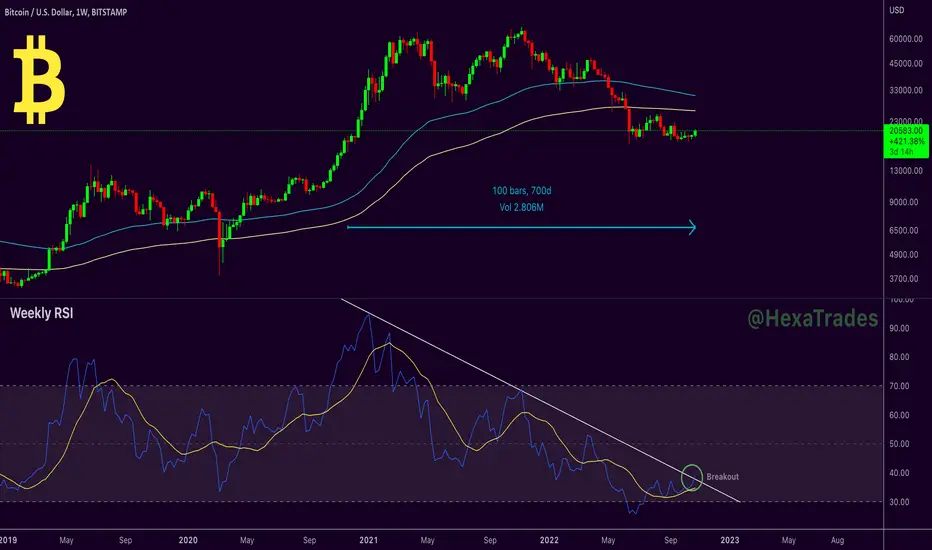
Bitcoin's weekly RSI falling from the last 2 years, In December 2020 weekly RSI touched 95 overbought levels, at the time BTC was trading at $42000 after that RSI started falling.
In the above chart, you can see Bitcoin 2 year-long Weekly RSI breakout above its trend resistance line, this is a good bullish sign for bitcoin.
Thanks
Hexa
Bitcoin's weekly RSI falling from the last 2 years, In December 2020 weekly RSI touched 95 overbought levels, at the time BTC was trading at $42000 after that RSI started falling.
In the above chart, you can see Bitcoin 2 year-long Weekly RSI breakout above its trend resistance line, this is a good bullish sign for bitcoin.
Thanks
Hexa
Nota
Chart Update
🚀Telegram : t.me/hexatrades
🌐Website: hexatrades.io/
🗣️Twitter(X): twitter.com/HexaTrades
🌐Website: hexatrades.io/
🗣️Twitter(X): twitter.com/HexaTrades
Publicaciones relacionadas
Exención de responsabilidad
La información y las publicaciones no constituyen, ni deben considerarse como, asesoramiento o recomendaciones financieras, de inversión, de trading u otro tipo, proporcionadas o respaldadas por TradingView. Obtenga más información en Condiciones de uso.
🚀Telegram : t.me/hexatrades
🌐Website: hexatrades.io/
🗣️Twitter(X): twitter.com/HexaTrades
🌐Website: hexatrades.io/
🗣️Twitter(X): twitter.com/HexaTrades
Publicaciones relacionadas
Exención de responsabilidad
La información y las publicaciones no constituyen, ni deben considerarse como, asesoramiento o recomendaciones financieras, de inversión, de trading u otro tipo, proporcionadas o respaldadas por TradingView. Obtenga más información en Condiciones de uso.