I'm not trading  BTCUSD or cryptos actively but "a chart is a chart" as my my master (he's called MightyOne) says.
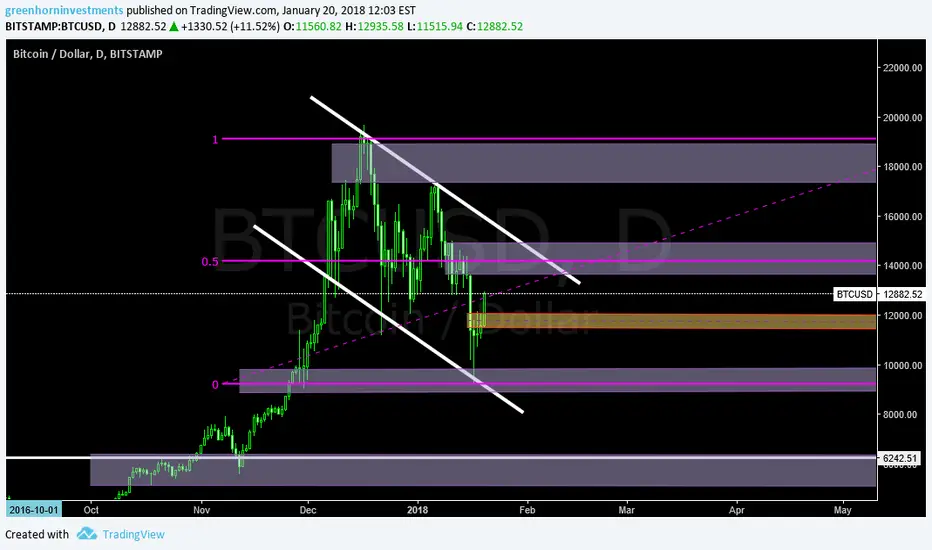
This is how i draw price levels (Supply&Demand) over my charts:
1) Supply is a zone (it doesn't matter how you are drawing it) around the top aka 0% or 25% RET in this chart.
2) Demand is a zone (it doesn't matter how you are drawing it) around the bottom aka 100% or 75% RET in this chart.
3) The midpoint is the midpoint LOL! Use it to take profits or to push in your direction when price is moving away from the actual range.
BTCUSD or cryptos actively but "a chart is a chart" as my my master (he's called MightyOne) says.This is how i draw price levels (Supply&Demand) over my charts:
1) Supply is a zone (it doesn't matter how you are drawing it) around the top aka 0% or 25% RET in this chart.
2) Demand is a zone (it doesn't matter how you are drawing it) around the bottom aka 100% or 75% RET in this chart.
3) The midpoint is the midpoint LOL! Use it to take profits or to push in your direction when price is moving away from the actual range.

Exención de responsabilidad
La información y las publicaciones no constituyen, ni deben considerarse como, asesoramiento o recomendaciones financieras, de inversión, de trading u otro tipo, proporcionadas o respaldadas por TradingView. Obtenga más información en Condiciones de uso.
Exención de responsabilidad
La información y las publicaciones no constituyen, ni deben considerarse como, asesoramiento o recomendaciones financieras, de inversión, de trading u otro tipo, proporcionadas o respaldadas por TradingView. Obtenga más información en Condiciones de uso.