
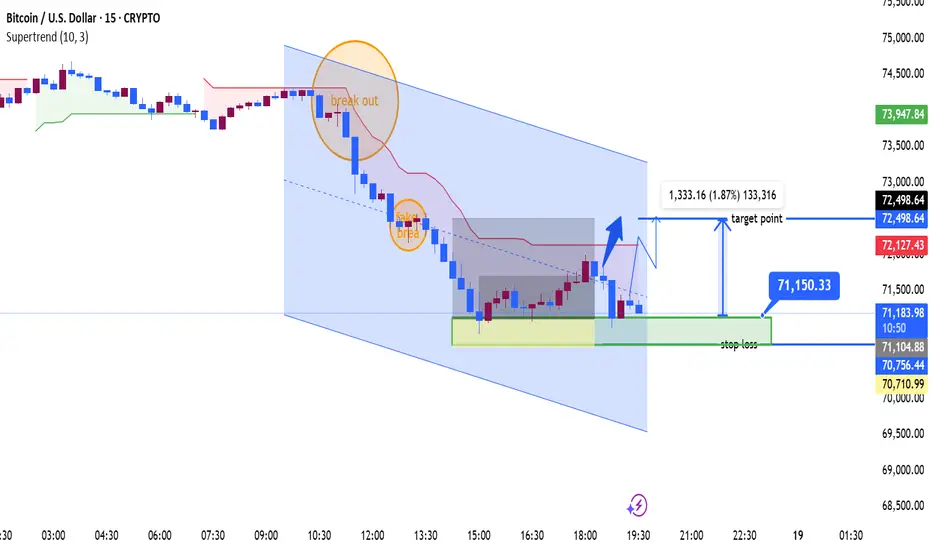
The market (Bitcoin / USD) is in a descending channel → clear short-term downtrend.
Price is respecting both:
Upper trendline (resistance)
Lower trendline (support)
⚠️ Key Signals on Your Chart
1. “Breakout” (actually a trap)
The marked breakout at the top failed quickly.
This is a classic bull trap → buyers entered, then price reversed sharply down.
2. “Fake break”
Midway down, there’s a fake breakdown / continuation signal.
Instead of reversing upward, price continued lower → confirms bearish momentum.
🟩 Current Situation (Important Zone)
Price is now sitting in a strong demand/support zone (~70.7k–71.3k).
This zone has:
Multiple touches (accumulation behavior)
A reaction bounce already
👉 This is why you marked a long setup
📊 Your Trade Idea (Long)
Entry
Around 71,150
Stop Loss
Below support (~70,700)
Good logic: below liquidity zone
Target
Around 72,500
Aligns with:
Channel mid/high
Prior resistance
Supertrend level
🧠 Trade Logic (Why it makes sense)
This is a counter-trend bounce trade, not a trend reversal:
✔ Oversold inside channel
✔ Strong horizontal support
✔ Potential short-term mean reversion
✔ Risk/Reward looks decent (~1.8%)
⚠️ Risks
You are trading against the trend (downtrend still intact)
If support breaks:
Price could quickly drop toward 69.5k–70k
No confirmed higher high yet → no real bullish structure
🔍 What You Should Watch Next
Bullish Confirmation
Break above 72,100–72,500
Strong candles + volume
Channel resistance test
Bearish Confirmation
Clean break below 70,700
Retest failure → continuation down
🧩 Simple Summary
Trend: Bearish
Setup: Support bounce (short-term long)
Bias: Cautiously bullish only inside support
Best play: Quick reaction trade, not swing hold

join my telegram channel t.me/goldsignalicthttps://t.me/goldsignalicthttps://t.me/goldsignalict
Exención de responsabilidad
La información y las publicaciones no constituyen, ni deben considerarse como, asesoramiento o recomendaciones financieras, de inversión, de trading u otro tipo, proporcionadas o respaldadas por TradingView. Obtenga más información en Condiciones de uso.