
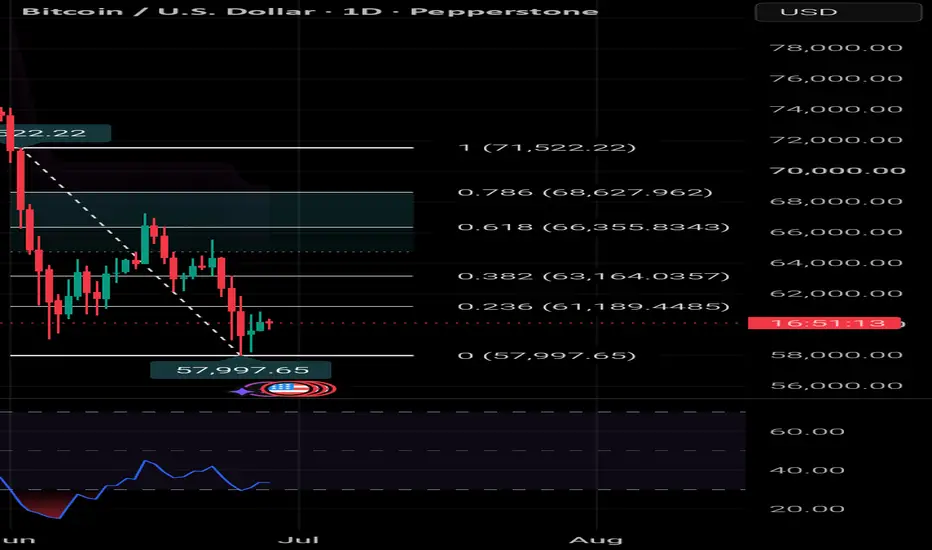
Bitcoin is currently trading around the 0.236 Fibonacci level ($61.2K) after bouncing from a strong support near $58K (0 Fib). This area has acted as a key demand zone, where buyers stepped in to defend the recent sell-off.
Bullish Scenario 📈
Holding above $58K keeps the short-term recovery intact.
A successful breakout above $61.2K (0.236 Fib) could open the path toward:
$63.2K (0.382 Fib)
$66.3K (0.618 Fib)
$68.6K (0.786 Fib)
Momentum is still weak, but the RSI is recovering from oversold territory, suggesting that bullish pressure is gradually returning.
Bearish Scenario 📉
Failure to reclaim the 0.236 Fib resistance may trigger another rejection.
A break below $58K would invalidate the current rebound and could lead to a deeper correction, potentially creating new swing lows.
Key Levels
🟢 Support: $58,000 🔴 Resistance: $61,190 | $63,164 | $66,356 | $68,628
Conclusion: BTC is attempting to build a base after a sharp decline. The market remains in a corrective structure until price can reclaim higher Fibonacci levels. Traders should watch for confirmation before anticipating a sustained trend reversal.
This is my personal technical analysis and not financial advice. Always manage your risk.
#BTC #Bitcoin #BTCUSD #Crypto #TechnicalAnalysis #TradingView #PriceAction #Fibonacci #SupportAndResistance #RiskManagement
Bullish Scenario 📈
Holding above $58K keeps the short-term recovery intact.
A successful breakout above $61.2K (0.236 Fib) could open the path toward:
$63.2K (0.382 Fib)
$66.3K (0.618 Fib)
$68.6K (0.786 Fib)
Momentum is still weak, but the RSI is recovering from oversold territory, suggesting that bullish pressure is gradually returning.
Bearish Scenario 📉
Failure to reclaim the 0.236 Fib resistance may trigger another rejection.
A break below $58K would invalidate the current rebound and could lead to a deeper correction, potentially creating new swing lows.
Key Levels
🟢 Support: $58,000 🔴 Resistance: $61,190 | $63,164 | $66,356 | $68,628
Conclusion: BTC is attempting to build a base after a sharp decline. The market remains in a corrective structure until price can reclaim higher Fibonacci levels. Traders should watch for confirmation before anticipating a sustained trend reversal.
This is my personal technical analysis and not financial advice. Always manage your risk.
#BTC #Bitcoin #BTCUSD #Crypto #TechnicalAnalysis #TradingView #PriceAction #Fibonacci #SupportAndResistance #RiskManagement

Exención de responsabilidad
La información y las publicaciones no constituyen, ni deben considerarse como, asesoramiento o recomendaciones financieras, de inversión, de trading u otro tipo, proporcionadas o respaldadas por TradingView. Obtenga más información en Condiciones de uso.
Exención de responsabilidad
La información y las publicaciones no constituyen, ni deben considerarse como, asesoramiento o recomendaciones financieras, de inversión, de trading u otro tipo, proporcionadas o respaldadas por TradingView. Obtenga más información en Condiciones de uso.