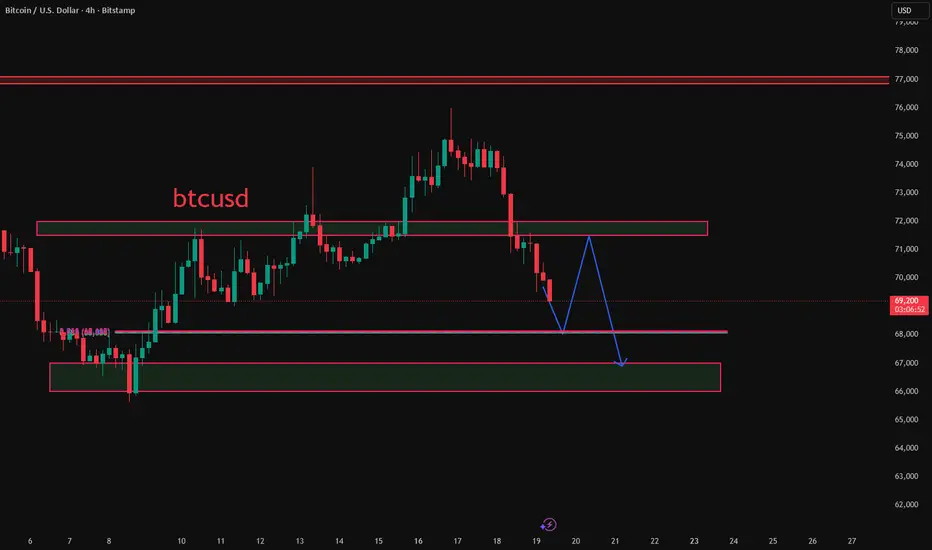
Yesterday, Federal Reserve Chairman Powell released hawkish signals, coupled with geopolitical risks, causing BTC to plummet from its high of $76,000, briefly falling below the key psychological level of $70,000. This decline was accompanied by increased trading volume, which has disrupted the daily chart's rebound structure.
Powell clearly stated that energy prices are driving up inflation risks. While the dot plot still retains one rate cut, several committee members shifted their expectations from two rate cuts to one, instantly suppressing market risk appetite.
Support zone: $66,000 - $67,000. This is a bearish zone if it breaks down. If the daily closing price falls below $69,000, it will likely test that area, signaling the resumption of a larger downtrend.
Resistance zone: $71,500 - $72,000. This area is the resistance level of the MA7 moving average and also the first area of dense trading volume after yesterday's decline. If the rebound fails to gain momentum and volume increases, it would be an ideal entry point for short positions.
Given that the current RSI is near 30, close to oversold but not yet bottomed out, and the MACD has formed a death cross on the daily chart, short-term trading should focus on selling on rallies, with buying as a secondary strategy, and strict stop-loss orders are essential.
We welcome all traders to share their opinions, and let's move forward together in this market.
 BTCUSD BTCUSD BTCUSD BTCUSD BTCUSD
Powell clearly stated that energy prices are driving up inflation risks. While the dot plot still retains one rate cut, several committee members shifted their expectations from two rate cuts to one, instantly suppressing market risk appetite.
Support zone: $66,000 - $67,000. This is a bearish zone if it breaks down. If the daily closing price falls below $69,000, it will likely test that area, signaling the resumption of a larger downtrend.
Resistance zone: $71,500 - $72,000. This area is the resistance level of the MA7 moving average and also the first area of dense trading volume after yesterday's decline. If the rebound fails to gain momentum and volume increases, it would be an ideal entry point for short positions.
Given that the current RSI is near 30, close to oversold but not yet bottomed out, and the MACD has formed a death cross on the daily chart, short-term trading should focus on selling on rallies, with buying as a secondary strategy, and strict stop-loss orders are essential.
We welcome all traders to share their opinions, and let's move forward together in this market.
BTCUSD BTCUSD BTCUSD BTCUSD BTCUSD Operación activa
After reaching the resistance level I marked in yesterday's article, BTC predictably pulled back, which is consistent with my analysis. The core contradiction in the current market lies in the fierce confrontation between the bullish daily chart pattern and the extremely panicked (fear index 11) market sentiment. From the 4-hour chart, Bitcoin is forming a potential right shoulder of a "head and shoulders" pattern, with the highs gradually decreasing and the overall trend being weak. The daily price chart shows the price remaining above the 200-week moving average ($68,098), indicating that long-term holdings have not loosened. In the short term, we will continue to trade around the resistance and support levels I have marked on the chart, and remember to take profits in a timely manner.Operación cerrada: objetivo alcanzado
A perfect pullback. Profits were made again.
Exención de responsabilidad
La información y las publicaciones no constituyen, ni deben considerarse como, asesoramiento o recomendaciones financieras, de inversión, de trading u otro tipo, proporcionadas o respaldadas por TradingView. Obtenga más información en Condiciones de uso.
Exención de responsabilidad
La información y las publicaciones no constituyen, ni deben considerarse como, asesoramiento o recomendaciones financieras, de inversión, de trading u otro tipo, proporcionadas o respaldadas por TradingView. Obtenga más información en Condiciones de uso.