
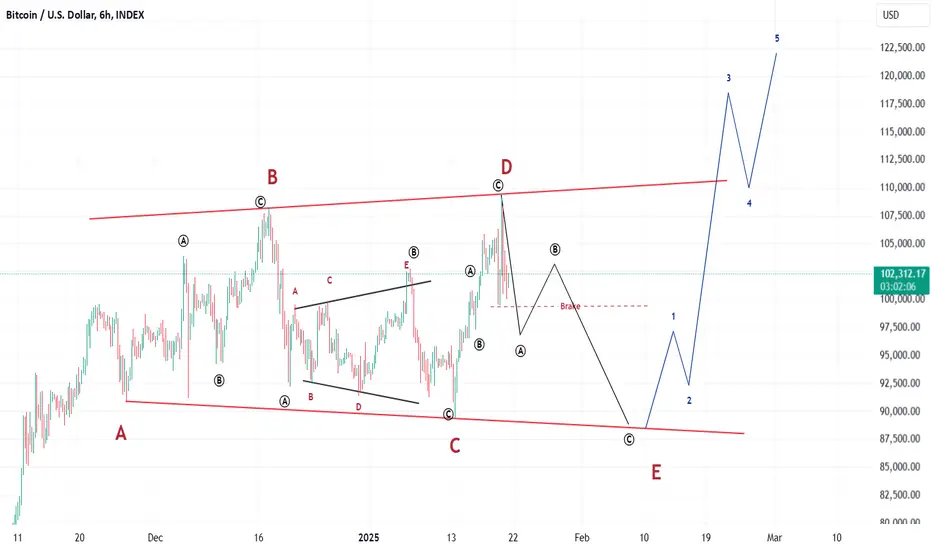
BTC peaked on November 23 and then entered a sideways corrective formation.
The corrective formation is called a reverse triangle, and it is characterized by the following features:
Three consecutive lower bottoms (A-B-C)
Two consecutive higher tops (B-D)
With the potential completion of the E bottom of the triangle, we can take a buy position on a lower timeframe if we identify a reversal pattern at the bottoms.
The initial target is a new all-time high.
The corrective formation is called a reverse triangle, and it is characterized by the following features:
Three consecutive lower bottoms (A-B-C)
Two consecutive higher tops (B-D)
With the potential completion of the E bottom of the triangle, we can take a buy position on a lower timeframe if we identify a reversal pattern at the bottoms.
The initial target is a new all-time high.

Exención de responsabilidad
La información y las publicaciones no constituyen, ni deben considerarse como, asesoramiento o recomendaciones financieras, de inversión, de trading u otro tipo, proporcionadas o respaldadas por TradingView. Obtenga más información en Condiciones de uso.
Exención de responsabilidad
La información y las publicaciones no constituyen, ni deben considerarse como, asesoramiento o recomendaciones financieras, de inversión, de trading u otro tipo, proporcionadas o respaldadas por TradingView. Obtenga más información en Condiciones de uso.