
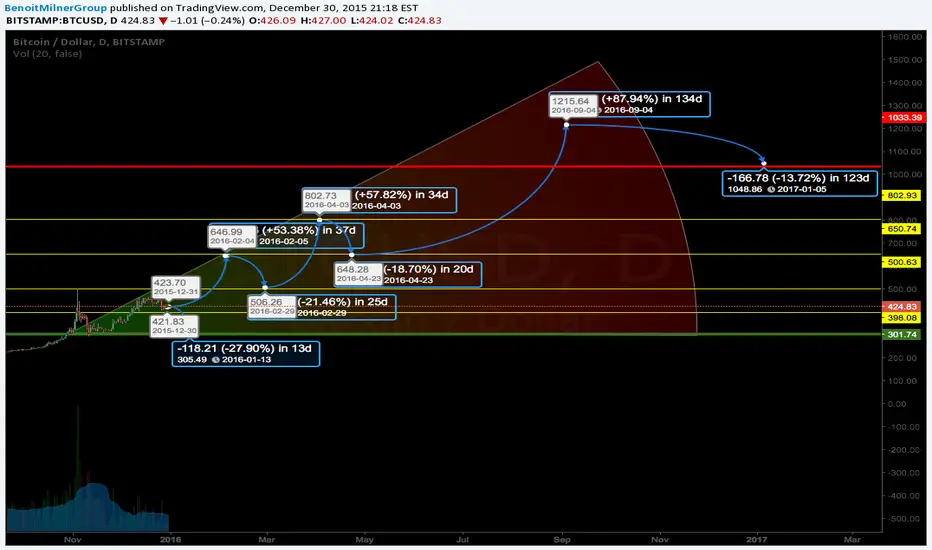
This is our Year Long Structure. If we see a break below $300 during the year the we should expect further selling but
We expect to see a gradual rise back to $1200 during 2016
The yellow lines represent "Key Levels" which could act as a support or a resistance.
The red and green lines represent "Strong Support & Strong Resistance.
But this is another very good guideline for trading BTC in 2016.
Posting some short term BTC ideas for January.
Remember to follow and any questions just comment!
We expect to see a gradual rise back to $1200 during 2016
The yellow lines represent "Key Levels" which could act as a support or a resistance.
The red and green lines represent "Strong Support & Strong Resistance.
But this is another very good guideline for trading BTC in 2016.
Posting some short term BTC ideas for January.
Remember to follow and any questions just comment!

Exención de responsabilidad
La información y las publicaciones no constituyen, ni deben considerarse como, asesoramiento o recomendaciones financieras, de inversión, de trading u otro tipo, proporcionadas o respaldadas por TradingView. Obtenga más información en Condiciones de uso.
Exención de responsabilidad
La información y las publicaciones no constituyen, ni deben considerarse como, asesoramiento o recomendaciones financieras, de inversión, de trading u otro tipo, proporcionadas o respaldadas por TradingView. Obtenga más información en Condiciones de uso.