
Hi every one
Bitcoin / U.S. Dollar
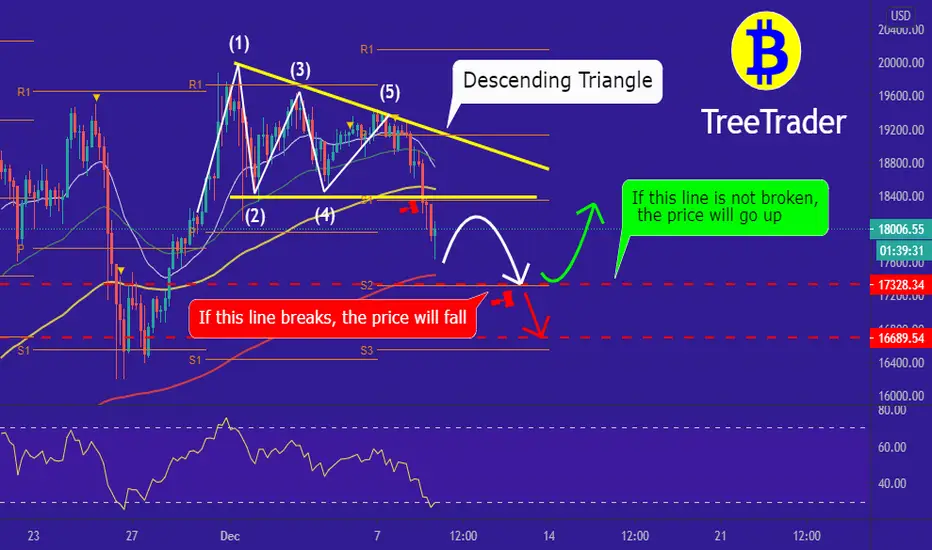
you can see the BTC/USD chart has broke the descending triangle which means the price has fallen also the Exponential Moving Average (EMA)200 and Pivot points (s2) are in a same spot so it is more likely that the price will reach that spot and make a pullback how ever if it reaches that spot and break it ,the price decrease dramatically!
we have dedicated a good amount of time for this analysis so support us by like and commenting our posts.
Things can change...
The markets are always changing and even with all these signals, the market changes tend to be strong and fast
Thank you for seeing idea .
Have a nice day and Good luck.
Bitcoin / U.S. Dollar
you can see the BTC/USD chart has broke the descending triangle which means the price has fallen also the Exponential Moving Average (EMA)200 and Pivot points (s2) are in a same spot so it is more likely that the price will reach that spot and make a pullback how ever if it reaches that spot and break it ,the price decrease dramatically!
we have dedicated a good amount of time for this analysis so support us by like and commenting our posts.
Things can change...
The markets are always changing and even with all these signals, the market changes tend to be strong and fast
Thank you for seeing idea .
Have a nice day and Good luck.
Nota
My previous Analysis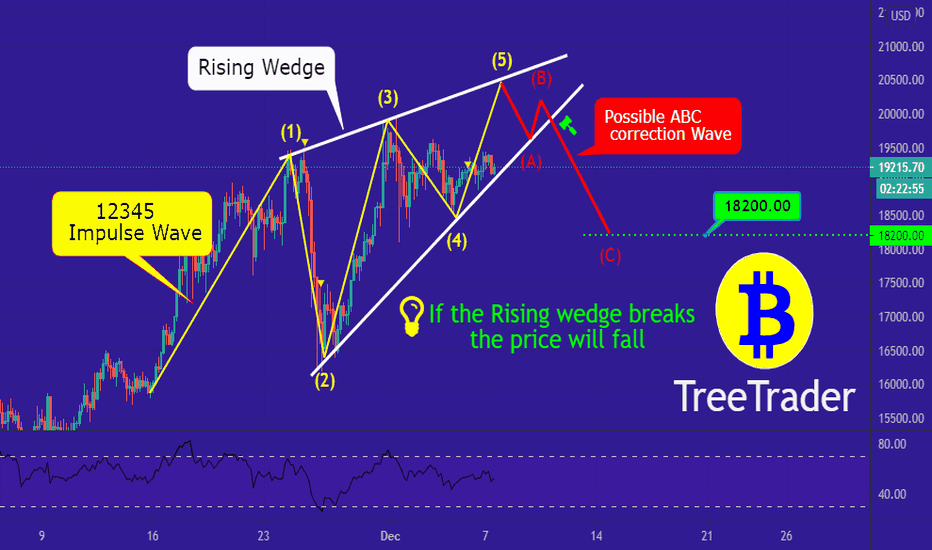
Orden cancelada

Publicaciones relacionadas
Exención de responsabilidad
La información y las publicaciones no constituyen, ni deben considerarse como, asesoramiento o recomendaciones financieras, de inversión, de trading u otro tipo, proporcionadas o respaldadas por TradingView. Obtenga más información en Condiciones de uso.
Publicaciones relacionadas
Exención de responsabilidad
La información y las publicaciones no constituyen, ni deben considerarse como, asesoramiento o recomendaciones financieras, de inversión, de trading u otro tipo, proporcionadas o respaldadas por TradingView. Obtenga más información en Condiciones de uso.