
Model Overview
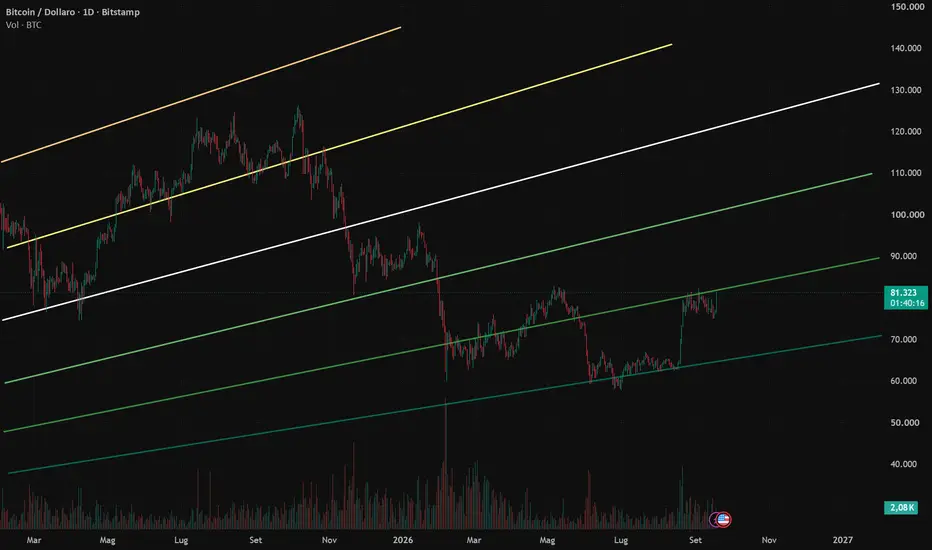
The Chimera Model 3D is a quantitative macro-valuation framework designed to model Bitcoin’s long-term fair value dynamics. By combining dual-currency geometric price filtering, monetary expansion deflation, a unified multi-variable growth vector, and dynamic volatility dampening, it establishes an objective baseline for long-term structural valuation.
1. Bivaluate Price Filtering & Monetary Neutralization
Dual-Currency Geometric Index: To eliminate single-fiat currency noise and localized liquidity distortions, the price series is calculated using a geometric mean of BTC/EUR and BTC/USD pairings (with direct currency conversion applied prior to 2014).
Aggregate Monetary Deflation (M2 & M3): The nominal price series is deflated against global M2 (USD) and Eurozone M3 monetary expansion. This process strips out monetary debasement and fiat inflation, isolating Bitcoin's true adoption trajectory in real economic terms.
2. Axis of Unified Maturity (AUM)
Spatiotemporal Vector Synthesis: Rather than relying solely on calendar time, the framework integrates elapsed time since the Genesis Block with the algorithmic emission schedule (Supply / Halvings) into a single synthetic vector termed the Axis of Unified Maturity (AUM).
Resolution of 2D Asymmetries: By replacing solar time with an intrinsic protocol age metric, the model eliminates the temporal distortions inherent in traditional two-dimensional power law models.
3. Additive Engine & Statistical Optimization (BIC)
NLS Log-Log Baseline: The deflated price series is projected onto the AUM axis using a log-log transformed Power Law baseline. Parameter optimization is conducted via unweighted Non-Linear Least Squares (NLS).
Parsimonious Model Selection (BIC): To account for potential network saturation or structural macro regime shifts, the engine dynamically evaluates additive sigmoidal modules (S-curves). Model selection is strictly governed by a heavily penalized Bayesian Information Criterion (BIC) to prevent overfitting and enforce mathematical parsimony.
4. Volatility Decay & 11 Thermodynamic Bands
Asset Weight Principle: The framework incorporates a structural volatility-dampening function, reflecting the mathematical reality that as Bitcoin's market capitalization grows, its marginal volatility decreases.
Dynamic 11-Band Channel: Applying this volatility decay along the AUM axis generates 11 dynamic thermodynamic bands. These bands progressively narrow over time, defining objective macro accumulation (Undervalued) and distribution (Overheated) regimes across multi-year cycles.
+1.00 / +1.25 | Positive Regime Change (Maroon): Parabolic structural expansion beyond historical thermodynamic limits.
+0.75 / +1.00 | Historical Blow-Off (Red): Extreme macro euphoria, historical cycle tops, and maximum risk asymmetry.
+0.50 / +0.75 | Cyclical Top Zone (Orange): Primary distribution regime and multi-year cycle peak formation.
+0.25 / +0.50 | Speculative Premium (Yellow): Speculative overheating and elevated valuation expansion above baseline.
0.00 / +0.25 | Moderate Premium (Light Yellow): Mild valuation premium over the intrinsic fair value median.
0.00 | Fair Value Median (White): The central economic equilibrium line after bivaluate geometric and fiat-neutralization adjustments.
0.00 / -0.25 | Moderate Discount (Lime): Initial structural undervaluation phase below equilibrium.
-0.25 / -0.50 | Value Accumulation (Green): Strategic long-term accumulation zone with high risk-adjusted reward.
-0.50 / -0.75 | Cyclical Bottom Zone (Teal): Bear market bottoming regime and macro seller exhaustion.
-0.75 / -1.00 | Systemic Shock (Blue): Extreme market distress triggered by systemic liquidity shocks.
-1.00 / -1.25 | Negative Regime Change (Purple): Anomaly regime reflecting structural macro dislocation below the model framework.
5. Quantitative Validation & Empirical Robustness
The framework was rigorously tested across the complete historical price dataset (5,700+ daily observations since Pizza Day) to evaluate centering, structural symmetry, and out-of-sample predictive stability:
Geometric Baricenter (Mean Log-Error): -0.0000 log-points
The Fair Value baseline exhibits perfect mathematical centering over historical price cycles, cutting through price distributions with zero chronic drift or structural bias.
Structural Symmetry (Yule-Bowley Index): +0.014
Evaluated on the central 50% interquartile range of residuals, the Yule-Bowley skewness index of +0.014 demonstrates an exceptionally balanced distribution around the median trajectory (< 0.10 threshold for strict symmetry).
Residual Dispersion (\sigma): 0.2874 log-points
The standard deviation of residuals remains well within the ideal structural range for Bitcoin (0.20 - 0.35), capturing cyclical bull/bear volatility without model degradation.
Daily In-Sample Fit (R^2): 0.9569
The complete daily model explains over 95.6\% of historical price variance across more than 5,700 trading days.
Walk-Forward Out-of-Sample Testing (R^2 OOS): 0.9208
Evaluated via an expanding-window Walk-Forward procedure across 129 historical evaluation windows (45-day step size from May 2010 to date), the pure out-of-sample R^2 consistently averaged 0.9208, exceeding institutional stability thresholds (>= 0.920).
6. Practical Application & Utility
What it is NOT intended for
Short-term signals or daily forecasting: The model is not designed to predict daily price action, intraday volatility, or immediate market reactions to short-term news and geopolitical events.
Leverage trading or timing exact pivots: It does not target precise daily tops or bottoms.
Core Utility & Strategic Value
Quantifying Distance from Fair Value: It measures exactly where the current price sits relative to its intrinsic, fiat-neutral baseline, providing a clear read on whether Bitcoin is trading at a structural discount or premium.
Probabilistic Asymmetry at Extremes: As price action moves toward the outer thermodynamic bands (<= -0.50 or >= +0.50), the risk/reward ratio shifts dramatically. Historically, trading at these outer boundaries represents statistically high-probability zones for mean reversion over multi-month horizons.
Strategic Macro Allocation: It serves as a navigational framework for long-term investors, wealth managers, and DCA strategies, helping differentiate between low-risk structural accumulation phases and high-risk distribution regimes.
Methodology Preview & Script Access
Note: The level overlays on this chart are a manual structural preview for demonstration purposes. The fully automated, dynamic Chimera Model 3D script operates on TradingView as a proprietary tool (Invite-Only). For further technical details or to request access to the automated indicator, please refer to my profile or send a direct message.
The Chimera Model 3D is a quantitative macro-valuation framework designed to model Bitcoin’s long-term fair value dynamics. By combining dual-currency geometric price filtering, monetary expansion deflation, a unified multi-variable growth vector, and dynamic volatility dampening, it establishes an objective baseline for long-term structural valuation.
1. Bivaluate Price Filtering & Monetary Neutralization
Dual-Currency Geometric Index: To eliminate single-fiat currency noise and localized liquidity distortions, the price series is calculated using a geometric mean of BTC/EUR and BTC/USD pairings (with direct currency conversion applied prior to 2014).
Aggregate Monetary Deflation (M2 & M3): The nominal price series is deflated against global M2 (USD) and Eurozone M3 monetary expansion. This process strips out monetary debasement and fiat inflation, isolating Bitcoin's true adoption trajectory in real economic terms.
2. Axis of Unified Maturity (AUM)
Spatiotemporal Vector Synthesis: Rather than relying solely on calendar time, the framework integrates elapsed time since the Genesis Block with the algorithmic emission schedule (Supply / Halvings) into a single synthetic vector termed the Axis of Unified Maturity (AUM).
Resolution of 2D Asymmetries: By replacing solar time with an intrinsic protocol age metric, the model eliminates the temporal distortions inherent in traditional two-dimensional power law models.
3. Additive Engine & Statistical Optimization (BIC)
NLS Log-Log Baseline: The deflated price series is projected onto the AUM axis using a log-log transformed Power Law baseline. Parameter optimization is conducted via unweighted Non-Linear Least Squares (NLS).
Parsimonious Model Selection (BIC): To account for potential network saturation or structural macro regime shifts, the engine dynamically evaluates additive sigmoidal modules (S-curves). Model selection is strictly governed by a heavily penalized Bayesian Information Criterion (BIC) to prevent overfitting and enforce mathematical parsimony.
4. Volatility Decay & 11 Thermodynamic Bands
Asset Weight Principle: The framework incorporates a structural volatility-dampening function, reflecting the mathematical reality that as Bitcoin's market capitalization grows, its marginal volatility decreases.
Dynamic 11-Band Channel: Applying this volatility decay along the AUM axis generates 11 dynamic thermodynamic bands. These bands progressively narrow over time, defining objective macro accumulation (Undervalued) and distribution (Overheated) regimes across multi-year cycles.
+1.00 / +1.25 | Positive Regime Change (Maroon): Parabolic structural expansion beyond historical thermodynamic limits.
+0.75 / +1.00 | Historical Blow-Off (Red): Extreme macro euphoria, historical cycle tops, and maximum risk asymmetry.
+0.50 / +0.75 | Cyclical Top Zone (Orange): Primary distribution regime and multi-year cycle peak formation.
+0.25 / +0.50 | Speculative Premium (Yellow): Speculative overheating and elevated valuation expansion above baseline.
0.00 / +0.25 | Moderate Premium (Light Yellow): Mild valuation premium over the intrinsic fair value median.
0.00 | Fair Value Median (White): The central economic equilibrium line after bivaluate geometric and fiat-neutralization adjustments.
0.00 / -0.25 | Moderate Discount (Lime): Initial structural undervaluation phase below equilibrium.
-0.25 / -0.50 | Value Accumulation (Green): Strategic long-term accumulation zone with high risk-adjusted reward.
-0.50 / -0.75 | Cyclical Bottom Zone (Teal): Bear market bottoming regime and macro seller exhaustion.
-0.75 / -1.00 | Systemic Shock (Blue): Extreme market distress triggered by systemic liquidity shocks.
-1.00 / -1.25 | Negative Regime Change (Purple): Anomaly regime reflecting structural macro dislocation below the model framework.
5. Quantitative Validation & Empirical Robustness
The framework was rigorously tested across the complete historical price dataset (5,700+ daily observations since Pizza Day) to evaluate centering, structural symmetry, and out-of-sample predictive stability:
Geometric Baricenter (Mean Log-Error): -0.0000 log-points
The Fair Value baseline exhibits perfect mathematical centering over historical price cycles, cutting through price distributions with zero chronic drift or structural bias.
Structural Symmetry (Yule-Bowley Index): +0.014
Evaluated on the central 50% interquartile range of residuals, the Yule-Bowley skewness index of +0.014 demonstrates an exceptionally balanced distribution around the median trajectory (< 0.10 threshold for strict symmetry).
Residual Dispersion (\sigma): 0.2874 log-points
The standard deviation of residuals remains well within the ideal structural range for Bitcoin (0.20 - 0.35), capturing cyclical bull/bear volatility without model degradation.
Daily In-Sample Fit (R^2): 0.9569
The complete daily model explains over 95.6\% of historical price variance across more than 5,700 trading days.
Walk-Forward Out-of-Sample Testing (R^2 OOS): 0.9208
Evaluated via an expanding-window Walk-Forward procedure across 129 historical evaluation windows (45-day step size from May 2010 to date), the pure out-of-sample R^2 consistently averaged 0.9208, exceeding institutional stability thresholds (>= 0.920).
6. Practical Application & Utility
What it is NOT intended for
Short-term signals or daily forecasting: The model is not designed to predict daily price action, intraday volatility, or immediate market reactions to short-term news and geopolitical events.
Leverage trading or timing exact pivots: It does not target precise daily tops or bottoms.
Core Utility & Strategic Value
Quantifying Distance from Fair Value: It measures exactly where the current price sits relative to its intrinsic, fiat-neutral baseline, providing a clear read on whether Bitcoin is trading at a structural discount or premium.
Probabilistic Asymmetry at Extremes: As price action moves toward the outer thermodynamic bands (<= -0.50 or >= +0.50), the risk/reward ratio shifts dramatically. Historically, trading at these outer boundaries represents statistically high-probability zones for mean reversion over multi-month horizons.
Strategic Macro Allocation: It serves as a navigational framework for long-term investors, wealth managers, and DCA strategies, helping differentiate between low-risk structural accumulation phases and high-risk distribution regimes.
Methodology Preview & Script Access
Note: The level overlays on this chart are a manual structural preview for demonstration purposes. The fully automated, dynamic Chimera Model 3D script operates on TradingView as a proprietary tool (Invite-Only). For further technical details or to request access to the automated indicator, please refer to my profile or send a direct message.

Exención de responsabilidad
La información y las publicaciones no constituyen, ni deben considerarse como, asesoramiento o recomendaciones financieras, de inversión, de trading u otro tipo, proporcionadas o respaldadas por TradingView. Obtenga más información en Condiciones de uso.
Exención de responsabilidad
La información y las publicaciones no constituyen, ni deben considerarse como, asesoramiento o recomendaciones financieras, de inversión, de trading u otro tipo, proporcionadas o respaldadas por TradingView. Obtenga más información en Condiciones de uso.