
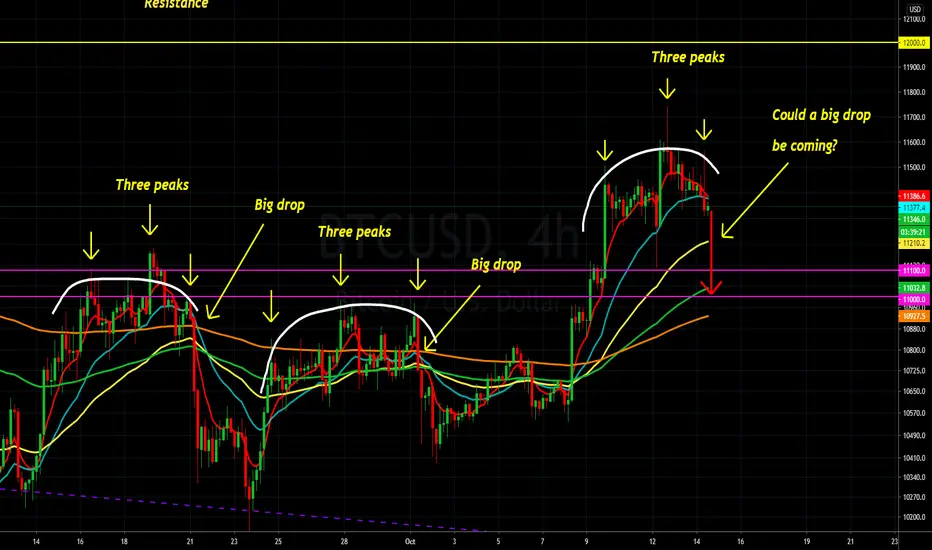
I'm seeing a repeating pattern in bitcoins price action. This chart is the 4 hour time frame but I also see a similar pattern on the daily which spanned the whole month of August. The pattern consists of three peaks that form a sort of dome pattern with the highest peak in the middle. As this latest pattern completes I am wondering whether it will also conclude with a large pull back. Not earth shattering analysis but just a pattern that to me looks like bitcoin keeps repeating lately.

Nota
Okay, maybe this latest peak is the real third peak. 
Exención de responsabilidad
La información y las publicaciones no constituyen, ni deben considerarse como, asesoramiento o recomendaciones financieras, de inversión, de trading u otro tipo, proporcionadas o respaldadas por TradingView. Obtenga más información en Condiciones de uso.
Exención de responsabilidad
La información y las publicaciones no constituyen, ni deben considerarse como, asesoramiento o recomendaciones financieras, de inversión, de trading u otro tipo, proporcionadas o respaldadas por TradingView. Obtenga más información en Condiciones de uso.