
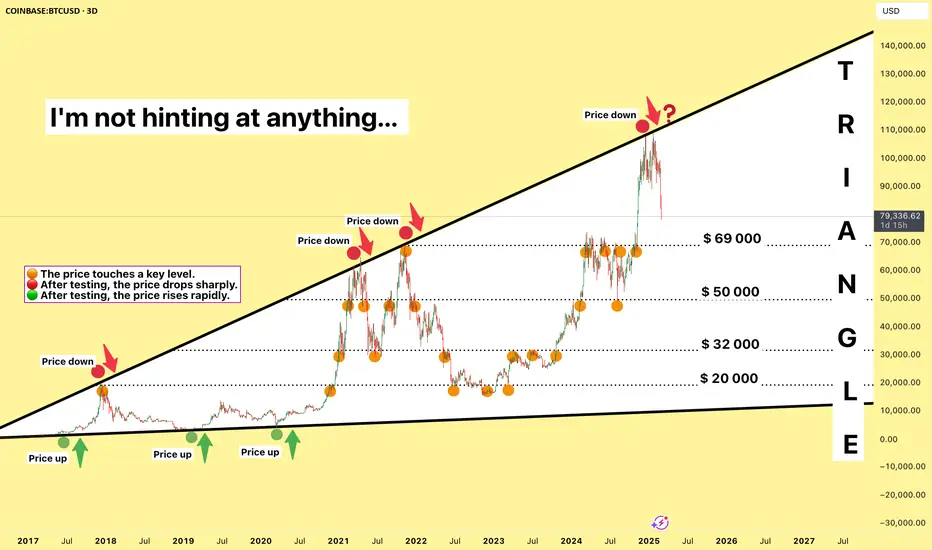
Hey, traders! 👋 Bitcoin is currently forming an inverted triangle, a pattern that often signals strong volatility ahead. Take a close look at the chart—I've marked key moments with different colored circles:
🟠 The price touches a key level.
🔴 After testing, the price drops sharply.
🟢 After testing, the price rises rapidly.
The levels are clearly visible on the chart, but what happens next? That’s the big question!
I’m not hinting at anything—this chart is open for interpretation. Everyone sees what they want to see, or maybe it helps deepen your own analysis.
So, what do YOU see? Where is Bitcoin headed next? Let’s discuss in the comments!
Thanks for Your attention🫶
Sincerely Yours, Kateryna 💛
🟠 The price touches a key level.
🔴 After testing, the price drops sharply.
🟢 After testing, the price rises rapidly.
The levels are clearly visible on the chart, but what happens next? That’s the big question!
I’m not hinting at anything—this chart is open for interpretation. Everyone sees what they want to see, or maybe it helps deepen your own analysis.
So, what do YOU see? Where is Bitcoin headed next? Let’s discuss in the comments!
Thanks for Your attention🫶
Sincerely Yours, Kateryna 💛
Operación activa
The MACD indicator is usually very informative on the weekly chart.

Publicaciones relacionadas
Exención de responsabilidad
La información y las publicaciones no constituyen, ni deben considerarse como, asesoramiento o recomendaciones financieras, de inversión, de trading u otro tipo, proporcionadas o respaldadas por TradingView. Obtenga más información en Condiciones de uso.
Publicaciones relacionadas
Exención de responsabilidad
La información y las publicaciones no constituyen, ni deben considerarse como, asesoramiento o recomendaciones financieras, de inversión, de trading u otro tipo, proporcionadas o respaldadas por TradingView. Obtenga más información en Condiciones de uso.