
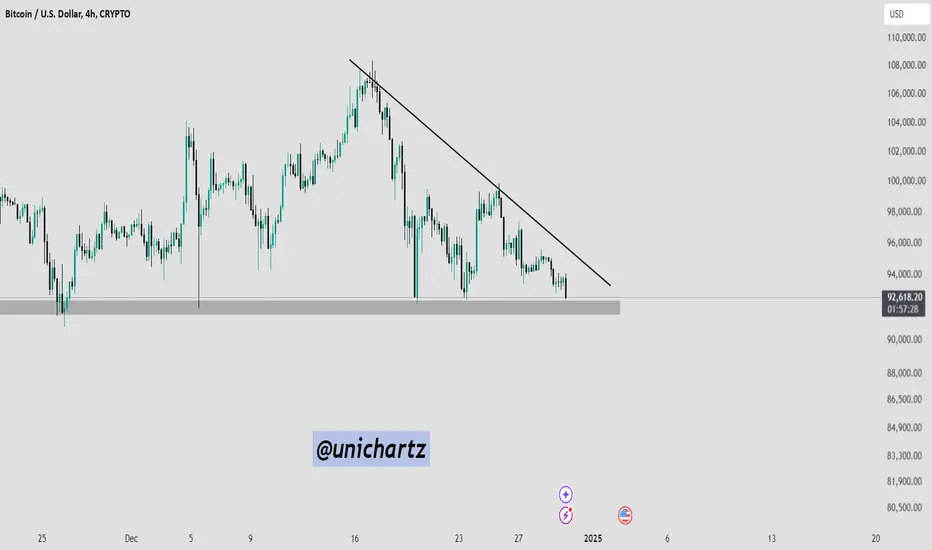
The BTC/USD 4-hour chart highlights a key support zone at $91,600–$92,200, acting as a strong barrier against further downside. The price is consolidating near this level, with a descending trendline adding bearish pressure.
A bounce from this support could retest the trendline around $94,000–$95,000, while a break below $91,600 may trigger a decline toward $86,000 or lower. Traders should watch for confirmation of a bounce or breakdown.
A bounce from this support could retest the trendline around $94,000–$95,000, while a break below $91,600 may trigger a decline toward $86,000 or lower. Traders should watch for confirmation of a bounce or breakdown.

Daily Free Signals :bit.ly/UnichartzAlpha
Register on Bitunix and trade with me: 👇
bitunix.com/register?vipCode=coEA
Register on Bitunix and trade with me: 👇
bitunix.com/register?vipCode=coEA
Exención de responsabilidad
La información y las publicaciones no constituyen, ni deben considerarse como, asesoramiento o recomendaciones financieras, de inversión, de trading u otro tipo, proporcionadas o respaldadas por TradingView. Obtenga más información en Condiciones de uso.
Daily Free Signals :bit.ly/UnichartzAlpha
Register on Bitunix and trade with me: 👇
bitunix.com/register?vipCode=coEA
Register on Bitunix and trade with me: 👇
bitunix.com/register?vipCode=coEA
Exención de responsabilidad
La información y las publicaciones no constituyen, ni deben considerarse como, asesoramiento o recomendaciones financieras, de inversión, de trading u otro tipo, proporcionadas o respaldadas por TradingView. Obtenga más información en Condiciones de uso.