
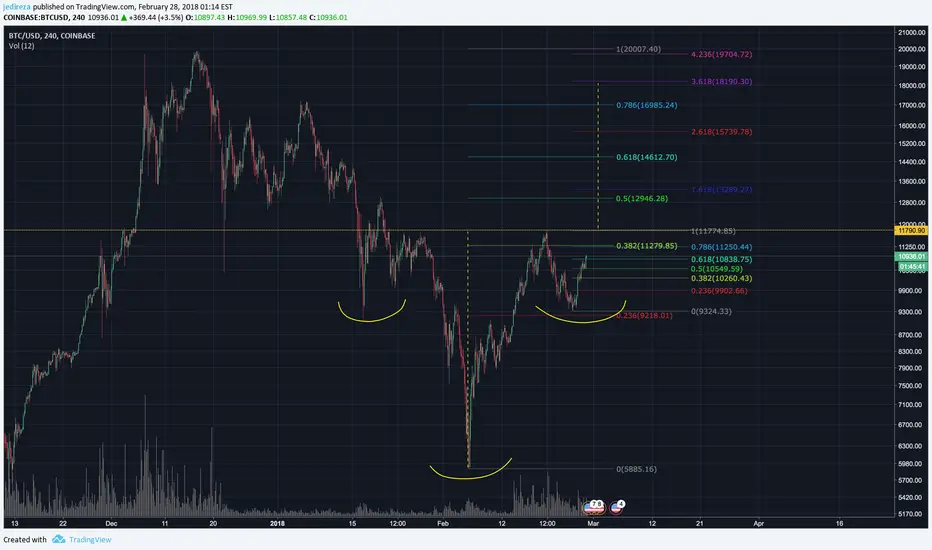
An inverse head and shoulder pattern is almost complete. If followed through, we could be looking at a target of around $18k. The volume profile is messy, though each major movement does have a decreasing volume trend.
Also shown are two fib retracements. One from all time high in mid December through the big dipper ending in the beginning of February. The second is a retracement is of the the right shoulder's high to low, and we can see price stepping up those levels.
It could also just go the other way ¯\_( $ )_/¯.
Also shown are two fib retracements. One from all time high in mid December through the big dipper ending in the beginning of February. The second is a retracement is of the the right shoulder's high to low, and we can see price stepping up those levels.
It could also just go the other way ¯\_( $ )_/¯.

Exención de responsabilidad
La información y las publicaciones no constituyen, ni deben considerarse como, asesoramiento o recomendaciones financieras, de inversión, de trading u otro tipo, proporcionadas o respaldadas por TradingView. Obtenga más información en Condiciones de uso.
Exención de responsabilidad
La información y las publicaciones no constituyen, ni deben considerarse como, asesoramiento o recomendaciones financieras, de inversión, de trading u otro tipo, proporcionadas o respaldadas por TradingView. Obtenga más información en Condiciones de uso.