
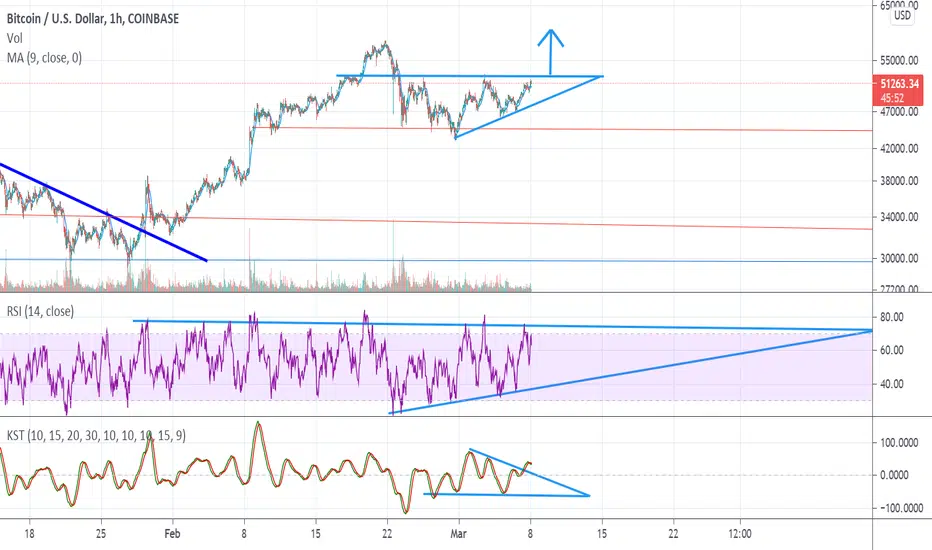
After breaking out from a crude bullish flag or what could have been considered a descending triangle linked to this post, BTC has consolidated into an Ascending Triangle drawn in light blue.
On the RSI there is a similar pattern as the price action, notice the series of higher lows along with the blue upward sloping support of the Ascending Triangle.
On the KST there's been a breakout of potentially a bullish flag pattern on a macro level, on a micro time frame there's been a bearish cross displaying the red line crossing over downward of the green line.
On the RSI there is a similar pattern as the price action, notice the series of higher lows along with the blue upward sloping support of the Ascending Triangle.
On the KST there's been a breakout of potentially a bullish flag pattern on a macro level, on a micro time frame there's been a bearish cross displaying the red line crossing over downward of the green line.

Publicaciones relacionadas
Exención de responsabilidad
La información y las publicaciones no constituyen, ni deben considerarse como, asesoramiento o recomendaciones financieras, de inversión, de trading u otro tipo, proporcionadas o respaldadas por TradingView. Obtenga más información en Condiciones de uso.
Publicaciones relacionadas
Exención de responsabilidad
La información y las publicaciones no constituyen, ni deben considerarse como, asesoramiento o recomendaciones financieras, de inversión, de trading u otro tipo, proporcionadas o respaldadas por TradingView. Obtenga más información en Condiciones de uso.