My First Bitcoin Basic Technical Analysis
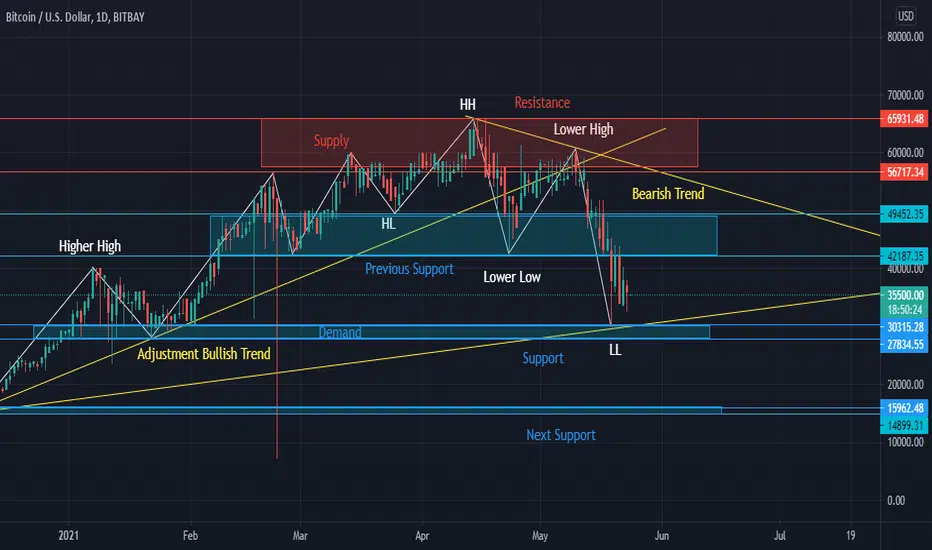
The 4 Basics:
1. Swing: in white line.
2. Trend: in yellow line.
3. Support & Resistance: Blue and Red lines.
4. Supply & Demand: in rectangles.
Summary:
The current trend is bearish after failing to break above $60000 and failing to maintain above $46000. A good buy opportunity between $28000 - $30000 especially if there is a rebound. However, a high probability of another market crash if the price drops below $28000 up to $16000 as the next support line.

Exención de responsabilidad
La información y las publicaciones no constituyen, ni deben considerarse como, asesoramiento o recomendaciones financieras, de inversión, de trading u otro tipo, proporcionadas o respaldadas por TradingView. Obtenga más información en Condiciones de uso.
Exención de responsabilidad
La información y las publicaciones no constituyen, ni deben considerarse como, asesoramiento o recomendaciones financieras, de inversión, de trading u otro tipo, proporcionadas o respaldadas por TradingView. Obtenga más información en Condiciones de uso.