
Hello everyone, 👋
We're back to BTC/USD once again.
Yesterday, we managed to capture a small but profitable move. Today, after the U.S. market close, the situation shifted and brought us a decline of approximately 1,000 points.
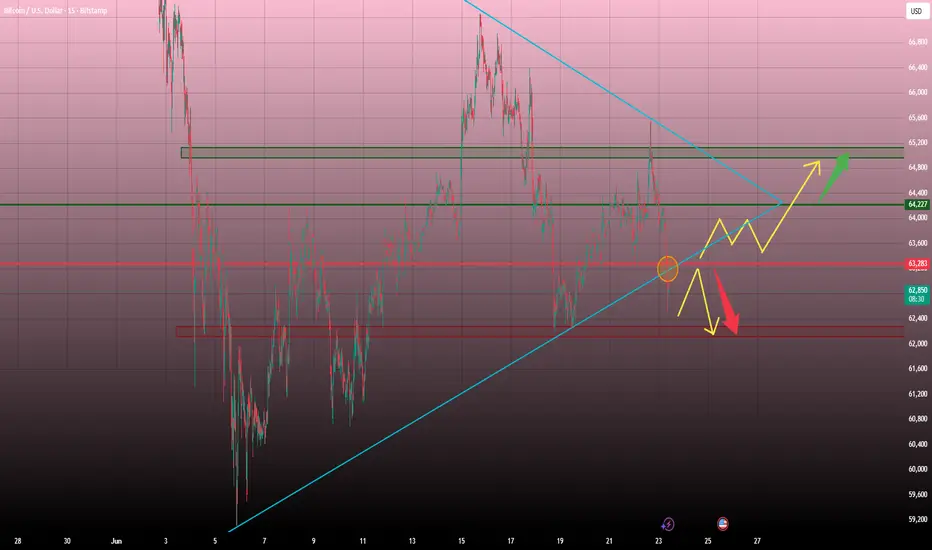
On the chart, we can see a forming triangle pattern, with the price currently breaking to the downside. However, to confirm the bearish scenario, we would ideally like to see a retest of the red trendline, followed by another move lower — a setup I plan to trade.
There is also a possibility that the price returns to the range between 64,200 and 63,200. In that case, it would be wise to wait for further confirmation and a clear breakout signal from the levels marked on the chart before taking any positions.
🟢 As always, a break above the green level will have me looking for immediate long opportunities.
🔴 A break below the red level will shift my focus toward potential short setups.
GOOD LUCK TRADERS !!
⚠️ This analysis is for educational and informational purposes only and should not be considered financial advice. Always conduct your own research and manage risk appropriately before making any trading decisions.
We're back to BTC/USD once again.
Yesterday, we managed to capture a small but profitable move. Today, after the U.S. market close, the situation shifted and brought us a decline of approximately 1,000 points.
On the chart, we can see a forming triangle pattern, with the price currently breaking to the downside. However, to confirm the bearish scenario, we would ideally like to see a retest of the red trendline, followed by another move lower — a setup I plan to trade.
There is also a possibility that the price returns to the range between 64,200 and 63,200. In that case, it would be wise to wait for further confirmation and a clear breakout signal from the levels marked on the chart before taking any positions.
🟢 As always, a break above the green level will have me looking for immediate long opportunities.
🔴 A break below the red level will shift my focus toward potential short setups.
GOOD LUCK TRADERS !!
⚠️ This analysis is for educational and informational purposes only and should not be considered financial advice. Always conduct your own research and manage risk appropriately before making any trading decisions.
Orden cancelada
Hello, 👋I'm forced to cancel this setup, even though the price is still moving within the levels we identified.
I did not enter a position because the conditions required for opening a trade were not met.
Maybe some of you managed to catch the move, though 😉!

Exención de responsabilidad
La información y las publicaciones no constituyen, ni deben considerarse como, asesoramiento o recomendaciones financieras, de inversión, de trading u otro tipo, proporcionadas o respaldadas por TradingView. Obtenga más información en Condiciones de uso.
Exención de responsabilidad
La información y las publicaciones no constituyen, ni deben considerarse como, asesoramiento o recomendaciones financieras, de inversión, de trading u otro tipo, proporcionadas o respaldadas por TradingView. Obtenga más información en Condiciones de uso.