
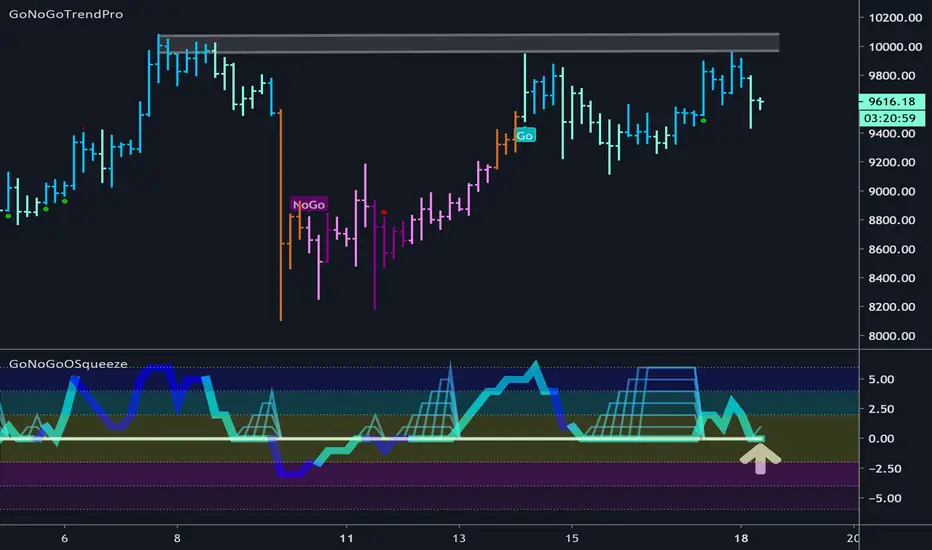
There really is a great deal of overhead resistance on the Bitcoin chart. Again turned away from around 10,000 price action has stalled causing the GoNoGo Trend to paint the weaker pale blue bars. The GoNoGo Oscillator reflects this cooling momentum as it has once again dropped to the zero line.
However, the GoNoGo Trend is still a "Go" and we are looking to see if the crypto can find support once more at the zero line. It should, and then we could expect price to push back up to 10,000 for another attempt to break above that level.
If zero doesn’t hold we could see price moving down and potentially a color change in the GoNoGo Trend indicator.
However, the GoNoGo Trend is still a "Go" and we are looking to see if the crypto can find support once more at the zero line. It should, and then we could expect price to push back up to 10,000 for another attempt to break above that level.
If zero doesn’t hold we could see price moving down and potentially a color change in the GoNoGo Trend indicator.

Exención de responsabilidad
La información y las publicaciones no constituyen, ni deben considerarse como, asesoramiento o recomendaciones financieras, de inversión, de trading u otro tipo, proporcionadas o respaldadas por TradingView. Obtenga más información en Condiciones de uso.
Exención de responsabilidad
La información y las publicaciones no constituyen, ni deben considerarse como, asesoramiento o recomendaciones financieras, de inversión, de trading u otro tipo, proporcionadas o respaldadas por TradingView. Obtenga más información en Condiciones de uso.