
BTCUSD 15M Bearish Setup Analysis
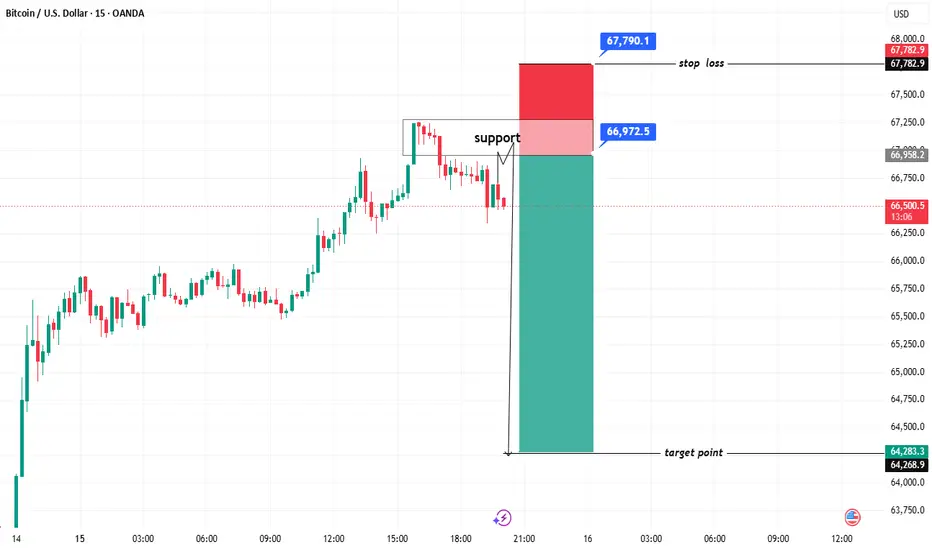
BTCUSD is currently showing signs of weakness after failing to hold above the recent intraday high near 67,250–67,300. Price has retraced back into a key support zone around 66,950–67,000, which is now acting as a decision area.
Bearish Scenario
The chart suggests a support retest around 66,972.
If sellers defend this zone and price fails to reclaim the recent high, bearish momentum could accelerate.
A break below short-term support may trigger further downside toward the target area.
Key Levels
Entry Zone: 66,950 – 67,000
Stop Loss: 67,790
Target: 64,283
Risk-to-Reward: Approximately 1:3.5
Technical View
Market structure shows a rejection from higher prices after a strong bullish impulse.
Lower highs are beginning to form on the 15-minute timeframe.
A confirmed break beneath support would strengthen the bearish outlook and favor continuation toward the lower liquidity zone near 64,300.
Trading Idea
Traders may watch for bearish confirmation (rejection candles, lower highs, or support breakdown) around 66,950–67,000 before considering short positions. A move above 67,790 would invalidate the bearish setup.
Bias: Bearish 📉
Target Zone: 64,283
Invalidation: 67,790
BTCUSD is currently showing signs of weakness after failing to hold above the recent intraday high near 67,250–67,300. Price has retraced back into a key support zone around 66,950–67,000, which is now acting as a decision area.
Bearish Scenario
The chart suggests a support retest around 66,972.
If sellers defend this zone and price fails to reclaim the recent high, bearish momentum could accelerate.
A break below short-term support may trigger further downside toward the target area.
Key Levels
Entry Zone: 66,950 – 67,000
Stop Loss: 67,790
Target: 64,283
Risk-to-Reward: Approximately 1:3.5
Technical View
Market structure shows a rejection from higher prices after a strong bullish impulse.
Lower highs are beginning to form on the 15-minute timeframe.
A confirmed break beneath support would strengthen the bearish outlook and favor continuation toward the lower liquidity zone near 64,300.
Trading Idea
Traders may watch for bearish confirmation (rejection candles, lower highs, or support breakdown) around 66,950–67,000 before considering short positions. A move above 67,790 would invalidate the bearish setup.
Bias: Bearish 📉
Target Zone: 64,283
Invalidation: 67,790
Operación activa

JOIN MY TELEGRAM CHANNEL LINK t.me/mindgolde JOIN MY TELEGRAM CHANNEL LINK t.me/mindgolde
Exención de responsabilidad
La información y las publicaciones no constituyen, ni deben considerarse como, asesoramiento o recomendaciones financieras, de inversión, de trading u otro tipo, proporcionadas o respaldadas por TradingView. Obtenga más información en Condiciones de uso.
JOIN MY TELEGRAM CHANNEL LINK t.me/mindgolde JOIN MY TELEGRAM CHANNEL LINK t.me/mindgolde
Exención de responsabilidad
La información y las publicaciones no constituyen, ni deben considerarse como, asesoramiento o recomendaciones financieras, de inversión, de trading u otro tipo, proporcionadas o respaldadas por TradingView. Obtenga más información en Condiciones de uso.