
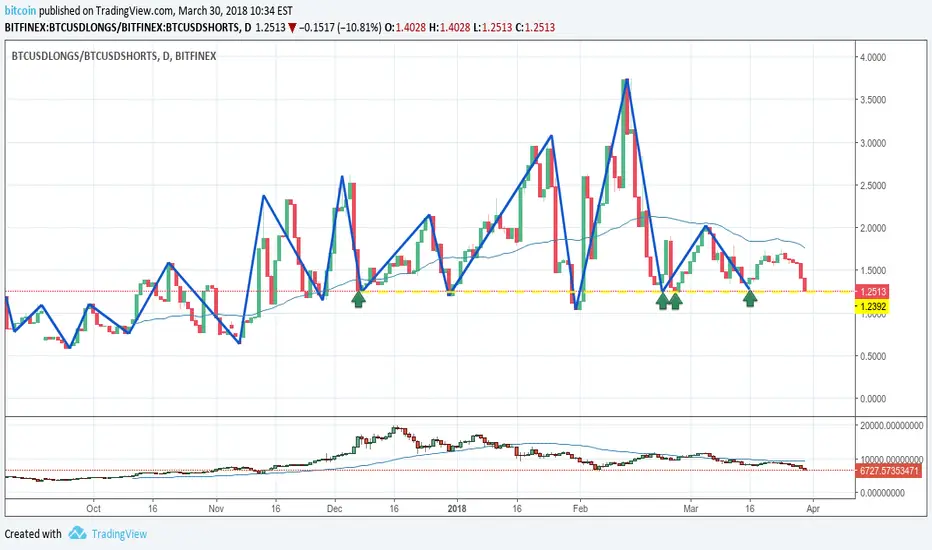
By taking longs/shorts ratio we get a cyclic chart and it is near past history lows. But as always it can break down on extreme panic sells and BTC is yet to see some panic like previous leg down to 6K. So I am sharing this as a point of attention.
Nota
Longs making a new high after hitting way lower than recent bottomsNota
Looks like a return to mean is probableNota
There is a double bottom so far, looking like it failed to bearish engulfing.Nota
double bottom lost, ratio is below 1 which means shorts are greater than longs, that's the lowest ratio in 2018Nota
Increasing bears margin with market going upwardNota
Bulls about to make a new higher high
Exención de responsabilidad
La información y las publicaciones no constituyen, ni deben considerarse como, asesoramiento o recomendaciones financieras, de inversión, de trading u otro tipo, proporcionadas o respaldadas por TradingView. Obtenga más información en Condiciones de uso.
Exención de responsabilidad
La información y las publicaciones no constituyen, ni deben considerarse como, asesoramiento o recomendaciones financieras, de inversión, de trading u otro tipo, proporcionadas o respaldadas por TradingView. Obtenga más información en Condiciones de uso.