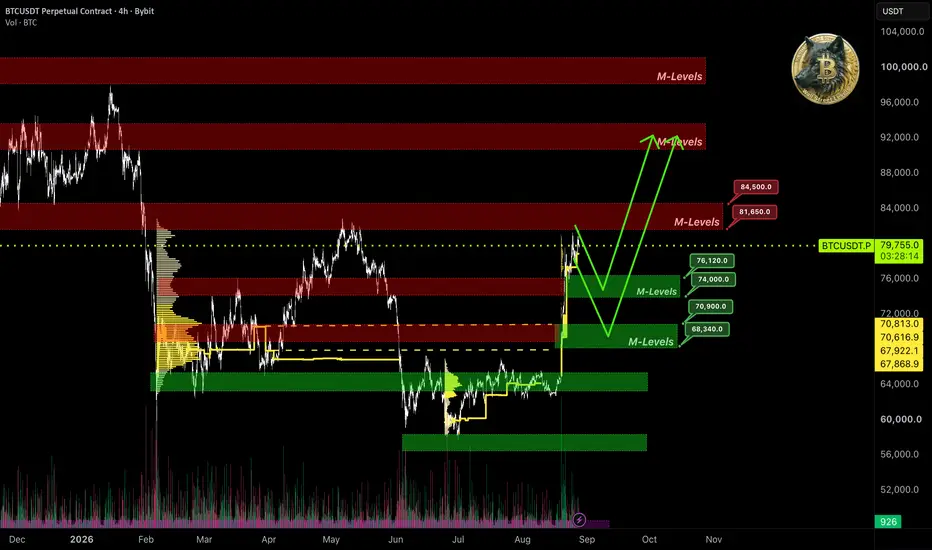
The week of  BTC anomalous run is wrapping up. Time to analyze the chart after support levels got rebuilt.
Right now price is right up against the historically strong monthly resistance 📊M-Levels $81650–$84500, where as 🧩IMA points out, 🐋large players started taking some profits.
Spot market also shows dropping inflows, from this we can conclude that the market took a pause and growth continues without new capital backing it.
A straight-up breakout of monthly resistance and further growth with this data is unlikely, in this setup if 🐋large players' mood stays bullish, a pullback to support levels for a reload looks logical, and only then a resistance breakout.
Chart shows that the nearest monthly support is 📊M-Levels $74000–$76000, where we should expect a reaction from 🐋large players.
Next strong 📊M-Levels $68340–$70900 I consider even more weighty, which is backed by order volume accumulation, a break of this level will break the growth structure, which could again lead to a prolonged flat.
Friends, that's my take on Bitcoin.
If you liked the analysis - support it with a rocket 🚀.
🧩IMA — Integrated Market Analysis
📊M-Levels — Institutional Interest Levels
⚠️ Platform restrictions don't allow publishing closed indicators. I only display the result of the 📊Levels algorithm.
BTC anomalous run is wrapping up. Time to analyze the chart after support levels got rebuilt.Right now price is right up against the historically strong monthly resistance 📊M-Levels $81650–$84500, where as 🧩IMA points out, 🐋large players started taking some profits.
Spot market also shows dropping inflows, from this we can conclude that the market took a pause and growth continues without new capital backing it.
A straight-up breakout of monthly resistance and further growth with this data is unlikely, in this setup if 🐋large players' mood stays bullish, a pullback to support levels for a reload looks logical, and only then a resistance breakout.
Chart shows that the nearest monthly support is 📊M-Levels $74000–$76000, where we should expect a reaction from 🐋large players.
Next strong 📊M-Levels $68340–$70900 I consider even more weighty, which is backed by order volume accumulation, a break of this level will break the growth structure, which could again lead to a prolonged flat.
Friends, that's my take on Bitcoin.
If you liked the analysis - support it with a rocket 🚀.
🧩IMA — Integrated Market Analysis
📊M-Levels — Institutional Interest Levels
⚠️ Platform restrictions don't allow publishing closed indicators. I only display the result of the 📊Levels algorithm.
Nota
Judging by 🐋large players' behavior, the monthly support at 📊M-Levels $74000–$76000 is highly likely to get broken. In that case, we can expect price to drop into the $68000–$70000 area, which lines up with the volume level.
More trading signals in my channel: t.me/well_street_levels
Publicaciones relacionadas
Exención de responsabilidad
La información y las publicaciones no constituyen, ni deben considerarse como, asesoramiento o recomendaciones financieras, de inversión, de trading u otro tipo, proporcionadas o respaldadas por TradingView. Obtenga más información en Condiciones de uso.
More trading signals in my channel: t.me/well_street_levels
Publicaciones relacionadas
Exención de responsabilidad
La información y las publicaciones no constituyen, ni deben considerarse como, asesoramiento o recomendaciones financieras, de inversión, de trading u otro tipo, proporcionadas o respaldadas por TradingView. Obtenga más información en Condiciones de uso.