
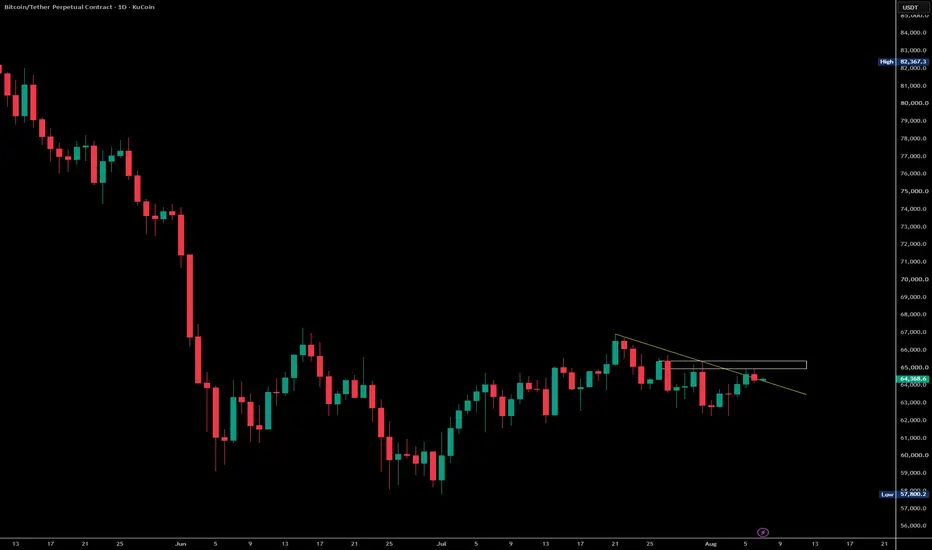
The chart shows Bitcoin consolidating below a descending trendline while testing a horizontal resistance zone around $65,000. Price has been making higher lows after the June bottom, but buyers still need to reclaim the resistance area to confirm bullish continuation.
Current Structure
📈 Recovery from the June lows remains intact.
📉 BTC is still trading below short-term descending resistance.
⚖️ Price is compressing beneath $65,000, suggesting a breakout or rejection is approaching.
Key Levels
🟢 Support
$63,000–63,500 (immediate support)
$60,000 (major support)
$57,800 (key swing low)
🔴 Resistance
$65,000–65,500 (horizontal resistance)
Descending trendline
$68,000–70,000 (next major resistance)
Bullish Scenario
A daily close above $65,500 and the descending trendline would confirm a bullish breakout.
Upside Targets
🎯 Target 1: $68,000
🎯 Target 2: $72,000
🎯 Target 3: $78,000–80,000
Bearish Scenario
If BTC is rejected from resistance and loses nearby support:
Downside Levels
📉 $63,000
📉 $60,000
📉 $57,800 (major support)
A breakdown below $57,800 would invalidate the current recovery and strengthen the bearish outlook.
Market Outlook
Bitcoin is neutral with a bullish bias as it continues to build higher lows beneath resistance. The $65,000–65,500 area is the key level to watch. A confirmed breakout could trigger the next impulsive move higher, while rejection would likely keep BTC range-bound or lead to another pullback.
Current Structure
📈 Recovery from the June lows remains intact.
📉 BTC is still trading below short-term descending resistance.
⚖️ Price is compressing beneath $65,000, suggesting a breakout or rejection is approaching.
Key Levels
🟢 Support
$63,000–63,500 (immediate support)
$60,000 (major support)
$57,800 (key swing low)
🔴 Resistance
$65,000–65,500 (horizontal resistance)
Descending trendline
$68,000–70,000 (next major resistance)
Bullish Scenario
A daily close above $65,500 and the descending trendline would confirm a bullish breakout.
Upside Targets
🎯 Target 1: $68,000
🎯 Target 2: $72,000
🎯 Target 3: $78,000–80,000
Bearish Scenario
If BTC is rejected from resistance and loses nearby support:
Downside Levels
📉 $63,000
📉 $60,000
📉 $57,800 (major support)
A breakdown below $57,800 would invalidate the current recovery and strengthen the bearish outlook.
Market Outlook
Bitcoin is neutral with a bullish bias as it continues to build higher lows beneath resistance. The $65,000–65,500 area is the key level to watch. A confirmed breakout could trigger the next impulsive move higher, while rejection would likely keep BTC range-bound or lead to another pullback.

Twitter: x.com/crypto_vulture1
📊 TA & strategies
Telegram: t.me/crypto_vulture_signals
📊 TA & strategies
Telegram: t.me/crypto_vulture_signals
Exención de responsabilidad
La información y las publicaciones no constituyen, ni deben considerarse como, asesoramiento o recomendaciones financieras, de inversión, de trading u otro tipo, proporcionadas o respaldadas por TradingView. Obtenga más información en Condiciones de uso.
Twitter: x.com/crypto_vulture1
📊 TA & strategies
Telegram: t.me/crypto_vulture_signals
📊 TA & strategies
Telegram: t.me/crypto_vulture_signals
Exención de responsabilidad
La información y las publicaciones no constituyen, ni deben considerarse como, asesoramiento o recomendaciones financieras, de inversión, de trading u otro tipo, proporcionadas o respaldadas por TradingView. Obtenga más información en Condiciones de uso.