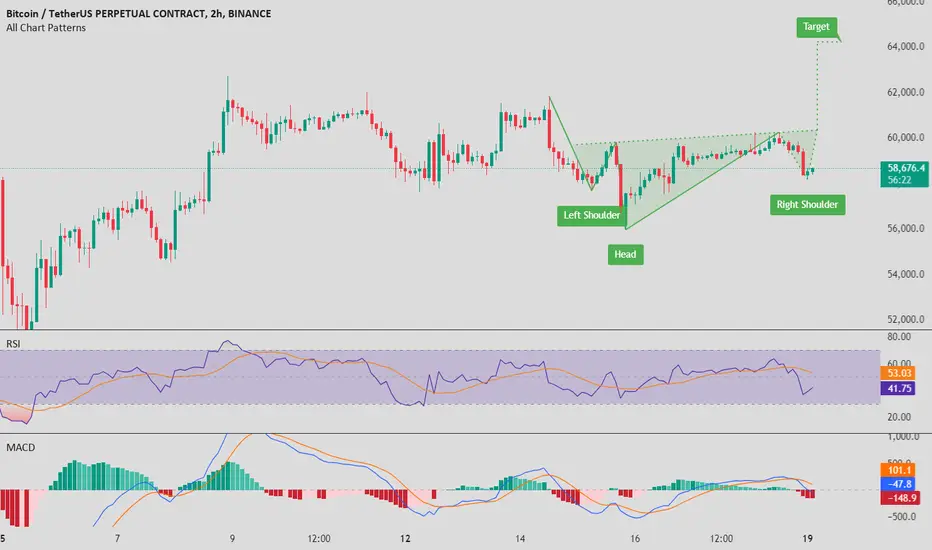
This 2-hour  BTC chart is showing a classic inverse head and shoulders pattern, which typically signals a bullish reversal. We can see that the right shoulder is currently forming, and if the pattern plays out, the price target could be around $64,000. The RSI has dipped below the midline, indicating a brief pullback, but it’s still in a healthy range. The MACD is in a bearish phase, but it could be signaling a potential bottom. Keep an eye on the neckline around $59,000; if BTC can break above that, it could confirm the bullish move.
Exención de responsabilidad
La información y las publicaciones no constituyen, ni deben considerarse como, asesoramiento o recomendaciones financieras, de inversión, de trading u otro tipo, proporcionadas o respaldadas por TradingView. Obtenga más información en Condiciones de uso.
Exención de responsabilidad
La información y las publicaciones no constituyen, ni deben considerarse como, asesoramiento o recomendaciones financieras, de inversión, de trading u otro tipo, proporcionadas o respaldadas por TradingView. Obtenga más información en Condiciones de uso.