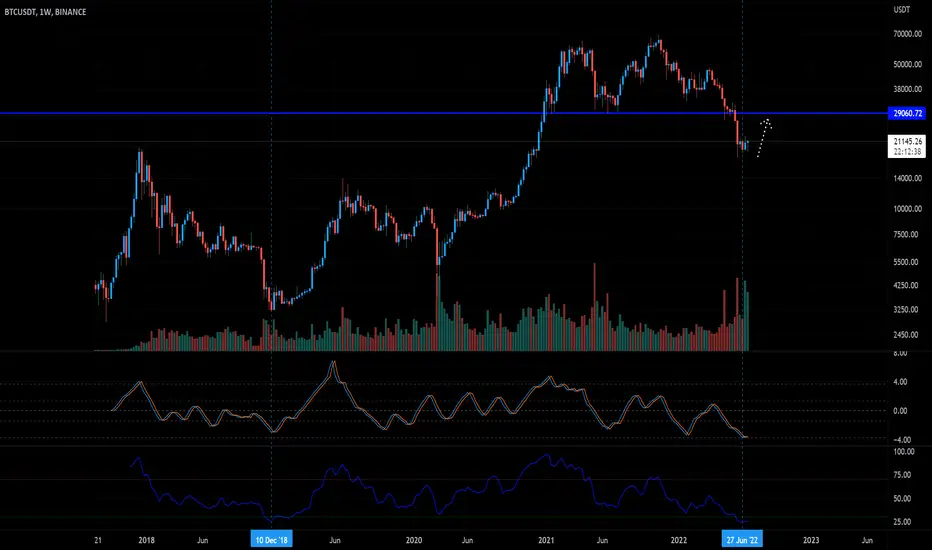
I'm thinking we see a retest of the previous support region around 29-30k before BTC attempts any further downward attempts
The weekly RSI here showing we are at a similar level to the 2018-19 bottom, Could we see an unexpected bullish swing upwards? Fisher indicator also showing signs of a reversal (crossing up)
Interesting point for BTC to be, time will tell.

 BTCUSDTBTCUSDBTCUSDBTCUSD
Nota
There's a cheeky bullish harmonic on the weekly tooNota
just look at the volume on the last green 2-week, higher than the dump candles, indicates reversal (just looking at volume)and you have the massive 2-weekly bullish harmonic that everyone seems to be ignoring.. these harmonics play out on almost all TF's.. it's extremely rare to get one on a high TF like the 2-week
Nota
Related charts are scattered throughout this idea:
Nota
Looking stronger on the chance of the bullish reversal harmonic playing out!Nota
closed 2-week above S2 which was an issue for a whileNota
Still chilling around here for now, no sign of invalidation yet which is good

Publicaciones relacionadas
Exención de responsabilidad
La información y las publicaciones no constituyen, ni deben considerarse como, asesoramiento o recomendaciones financieras, de inversión, de trading u otro tipo, proporcionadas o respaldadas por TradingView. Obtenga más información en Condiciones de uso.
Publicaciones relacionadas
Exención de responsabilidad
La información y las publicaciones no constituyen, ni deben considerarse como, asesoramiento o recomendaciones financieras, de inversión, de trading u otro tipo, proporcionadas o respaldadas por TradingView. Obtenga más información en Condiciones de uso.