
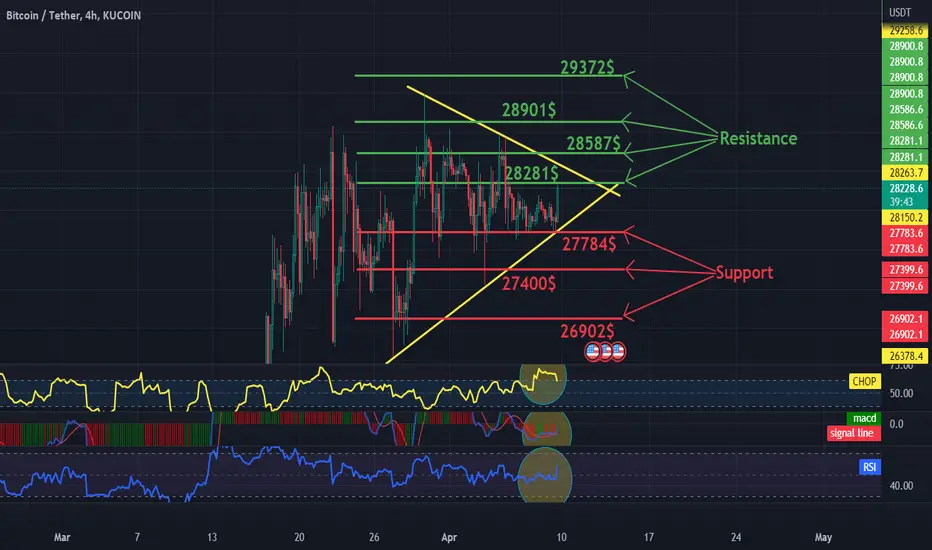
Hello everyone, let's look at the BTC to USDT chart on a 4-hour timeframe. As you can see, the price is moving within the triangle marked with yellow lines and is about to leave it.
Let's start with the support line and as you can see the first support in the near future is 27784, if the support is broken then the next support is $27400 and $26902.
Now let's move to the resistance line, as you can see the first resistance is $28281, if you manage to break it the next resistance will be $HKEX:28587, $28901 and $29372.
Looking at the CHOP indicator, we see that the energy is very charged, the MACD is on the verge of maintaining an uptrend, while the RSI is in the middle of the range, we have room for an upward exit from the triangle.
Let's start with the support line and as you can see the first support in the near future is
27784, if the support is broken then the next support is $27400 and $26902.Now let's move to the resistance line, as you can see the first resistance is $28281, if you manage to break it the next resistance will be $HKEX:28587, $28901 and $29372.
Looking at the CHOP indicator, we see that the energy is very charged, the MACD is on the verge of maintaining an uptrend, while the RSI is in the middle of the range, we have room for an upward exit from the triangle.

Exención de responsabilidad
La información y las publicaciones no constituyen, ni deben considerarse como, asesoramiento o recomendaciones financieras, de inversión, de trading u otro tipo, proporcionadas o respaldadas por TradingView. Obtenga más información en Condiciones de uso.
Exención de responsabilidad
La información y las publicaciones no constituyen, ni deben considerarse como, asesoramiento o recomendaciones financieras, de inversión, de trading u otro tipo, proporcionadas o respaldadas por TradingView. Obtenga más información en Condiciones de uso.