
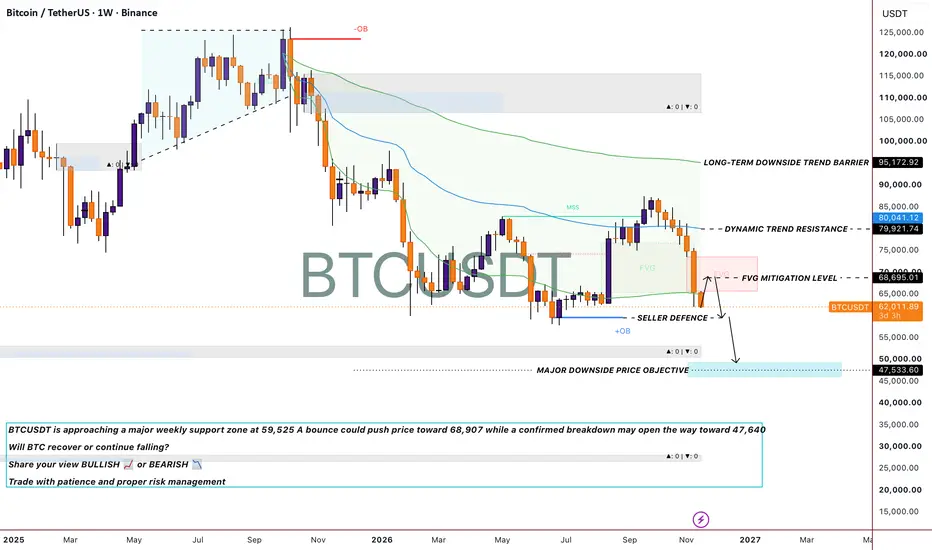
BTCUSDT Weekly Analysis | Economic Pressure Large Candles & Market Structure
Bitcoin’s weekly chart shows a significant change in market momentum. Large bearish candles weak recovery attempts and important support levels suggest that sellers have been dominating the market
1. Large Bearish Candles – Strong Selling Pressure
The large red candles indicate aggressive selling and strong downward momentum. Possible reasons include profit-taking, negative market sentiment, liquidations of leveraged long positions and reduced demand for risk assets
2. Large Bullish Candles – Buying Momentum
Strong green candles indicate that buyers entered the market with greater strength. Possible reasons include short covering, bargain buying, positive economic expectations or renewed institutional demand.
3. Long Upper Wicks – Selling at Higher Prices
When a weekly candle creates a long upper wick, it suggests that buyers pushed the price higher but sellers rejected those levels before the candle closed.
This may indicate profit-taking or strong selling interest near resistance.
4. Long Lower Wicks – Buying Interest
Long lower wicks suggest that sellers pushed the price down, but buyers entered before the candle closed. This can indicate demand or short-term rejection of lower prices.
However, a wick alone does not confirm a reversal.
5. Small Candles After a Large Move – Market Indecision
Small candle bodies following a large bearish or bullish candle may indicate slowing momentum, consolidation or uncertainty between buyers and sellers.
A breakout with confirmation is needed to identify the next direction.
6. Economic Factors Affecting Bitcoin
Several macroeconomic factors can influence Bitcoin’s movement:
* US Inflation: Higher-than-expected inflation may increase expectations of tighter monetary policy.
* Federal Reserve: Higher interest-rate expectations can pressure risk-sensitive assets.
* US Dollar Strength: A stronger dollar can create headwinds for Bitcoin.
* Global Liquidity: Tighter financial conditions may reduce speculative buying.
* ETF Flows: Strong inflows or outflows can influence institutional demand and market sentiment.
* Liquidations: High leverage can accelerate large price movements in either direction.
These are possible market influences, not confirmed explanations for each individual candle.
7. Important BTCUSDT Levels
* 80,042 – Major resistance
* 79,921 – Weekly structure level
* 68,907 – Important resistance / FVG
* 62,140 – Chart reference price
* 59,525 – Critical weekly support
* 47,640 – Potential downside objective
8. Bullish and Bearish Scenarios
Bullish Scenario: If BTC holds above 59,525 and forms strong bullish weekly candles, a recovery toward 68,907 may become possible.
Bearish Scenario: If BTC closes below 59,525 with strong bearish momentum, the next potential downside area is 47,640.
Final Market View
Bitcoin’s next major move may depend on economic data, Federal Reserve expectations, institutional flows and reactions at important technical levels.
Discussion: Are these large bearish candles showing the beginning of another major decline, or could Bitcoin be preparing for a strong recovery?
Share your opinion: BULLISH 📈 or BEARISH 📉
Educational technical analysis only. Candle patterns suggest possible market behaviour but cannot prove the exact cause of a price move. Always verify live data and use proper risk management.
Bitcoin’s weekly chart shows a significant change in market momentum. Large bearish candles weak recovery attempts and important support levels suggest that sellers have been dominating the market
1. Large Bearish Candles – Strong Selling Pressure
The large red candles indicate aggressive selling and strong downward momentum. Possible reasons include profit-taking, negative market sentiment, liquidations of leveraged long positions and reduced demand for risk assets
2. Large Bullish Candles – Buying Momentum
Strong green candles indicate that buyers entered the market with greater strength. Possible reasons include short covering, bargain buying, positive economic expectations or renewed institutional demand.
3. Long Upper Wicks – Selling at Higher Prices
When a weekly candle creates a long upper wick, it suggests that buyers pushed the price higher but sellers rejected those levels before the candle closed.
This may indicate profit-taking or strong selling interest near resistance.
4. Long Lower Wicks – Buying Interest
Long lower wicks suggest that sellers pushed the price down, but buyers entered before the candle closed. This can indicate demand or short-term rejection of lower prices.
However, a wick alone does not confirm a reversal.
5. Small Candles After a Large Move – Market Indecision
Small candle bodies following a large bearish or bullish candle may indicate slowing momentum, consolidation or uncertainty between buyers and sellers.
A breakout with confirmation is needed to identify the next direction.
6. Economic Factors Affecting Bitcoin
Several macroeconomic factors can influence Bitcoin’s movement:
* US Inflation: Higher-than-expected inflation may increase expectations of tighter monetary policy.
* Federal Reserve: Higher interest-rate expectations can pressure risk-sensitive assets.
* US Dollar Strength: A stronger dollar can create headwinds for Bitcoin.
* Global Liquidity: Tighter financial conditions may reduce speculative buying.
* ETF Flows: Strong inflows or outflows can influence institutional demand and market sentiment.
* Liquidations: High leverage can accelerate large price movements in either direction.
These are possible market influences, not confirmed explanations for each individual candle.
7. Important BTCUSDT Levels
* 80,042 – Major resistance
* 79,921 – Weekly structure level
* 68,907 – Important resistance / FVG
* 62,140 – Chart reference price
* 59,525 – Critical weekly support
* 47,640 – Potential downside objective
8. Bullish and Bearish Scenarios
Bullish Scenario: If BTC holds above 59,525 and forms strong bullish weekly candles, a recovery toward 68,907 may become possible.
Bearish Scenario: If BTC closes below 59,525 with strong bearish momentum, the next potential downside area is 47,640.
Final Market View
Bitcoin’s next major move may depend on economic data, Federal Reserve expectations, institutional flows and reactions at important technical levels.
Discussion: Are these large bearish candles showing the beginning of another major decline, or could Bitcoin be preparing for a strong recovery?
Share your opinion: BULLISH 📈 or BEARISH 📉
Educational technical analysis only. Candle patterns suggest possible market behaviour but cannot prove the exact cause of a price move. Always verify live data and use proper risk management.
Nota
📊 BTCUSDT – TRADING RULES & MANAGEMENTENTRY RULES
1. Wait for candle-close confirmation.
2. Identify important support and resistance zones.
3. Enter BUY after bullish confirmation.
4. Enter SELL after bearish confirmation.
5. Never chase a big candle.
TRADE MANAGEMENT
1. Hold the full position toward the final target while the setup remains valid.
2. Do not close 50% at the first target.
3. Follow Stop Loss strictly.
4. Adjust SL according to market structure to protect capital.
5. Exit if the trade setup becomes invalid.
RISK MANAGEMENT
1. Risk only a small portion of trading capital.
2. Avoid excessive leverage.
3. Never move SL farther away.
4. Avoid emotional and revenge trading.
5. Always follow your trading plan.
FULL POSITION HOLD – FINAL TARGET
Trade with patience. Follow the rules. Protect your capital.
Nota
🔴 BTCUSDT – SELL TRADE ACTIVESELL ENTRY: 63,000
PRICE TOUCHED: 61,000
PROFIT MOVEMENT: +2,000 PRICE POINTS 📉
✅ SELL trade is active and has moved 2,000 points in profit.
TRADE RULES:
1. Hold the full position toward the final target while bearish momentum remains valid.
2. Do not close 50% at the first target.
3. Follow Stop Loss strictly.
4. Avoid emotional decisions and over-leverage.
5. If strong bullish reversal appears, reassess the trade
NEXT PLAN: Follow the market structure and wait for the final target
⚠️ Exact broker pips depend on BTCUSD contract specifications
STAY DISCIPLINED. FOLLOW THE PLAN. PROTECT YOUR CAPITAL
Operación activa
🚨 BTCUSDT – SELL TRADE ACTIVE
🔴 SELL ENTRY: 63,000
🎯 PRICE TOUCHED: 57,000
📉 TOTAL MOVEMENT: +6,000 PRICE POINTS
✅ SELL trade has moved 6,000 points in profit.
TRADE MANAGEMENT RULES
1. Hold the full position toward the final target while bearish momentum remains valid.
2. Do not close 50% at the first target.
3. Follow Stop Loss strictly.
4. Protect profits and avoid emotional decisions.
5. If strong bullish reversal appears, reassess the trade.
6. Follow the trading plan until the final target or setup invalidation.
⚠️ Exact broker pips depend on BTCUSD contract specifications.
6,000 POINTS MOVE – STAY DISCIPLINED AND FOLLOW THE PLAN!

━━━━━━━━━━━━━━━━━━━━
📊 GOLD MASTER | XAUUSD ANALYST
🎯 Smart Entries | Clear Targets | Risk Management
t.me/+2DkpJHaQjpI4NDE0
📈 Trade with Discipline, Not Emotions.
🔥 Stay Focused. Trade Smart.
━━━━━━━━━━━━━━━━━━━━
📊 GOLD MASTER | XAUUSD ANALYST
🎯 Smart Entries | Clear Targets | Risk Management
t.me/+2DkpJHaQjpI4NDE0
📈 Trade with Discipline, Not Emotions.
🔥 Stay Focused. Trade Smart.
━━━━━━━━━━━━━━━━━━━━
Publicaciones relacionadas
Exención de responsabilidad
La información y las publicaciones no constituyen, ni deben considerarse como, asesoramiento o recomendaciones financieras, de inversión, de trading u otro tipo, proporcionadas o respaldadas por TradingView. Obtenga más información en Condiciones de uso.
━━━━━━━━━━━━━━━━━━━━
📊 GOLD MASTER | XAUUSD ANALYST
🎯 Smart Entries | Clear Targets | Risk Management
t.me/+2DkpJHaQjpI4NDE0
📈 Trade with Discipline, Not Emotions.
🔥 Stay Focused. Trade Smart.
━━━━━━━━━━━━━━━━━━━━
📊 GOLD MASTER | XAUUSD ANALYST
🎯 Smart Entries | Clear Targets | Risk Management
t.me/+2DkpJHaQjpI4NDE0
📈 Trade with Discipline, Not Emotions.
🔥 Stay Focused. Trade Smart.
━━━━━━━━━━━━━━━━━━━━
Publicaciones relacionadas
Exención de responsabilidad
La información y las publicaciones no constituyen, ni deben considerarse como, asesoramiento o recomendaciones financieras, de inversión, de trading u otro tipo, proporcionadas o respaldadas por TradingView. Obtenga más información en Condiciones de uso.