
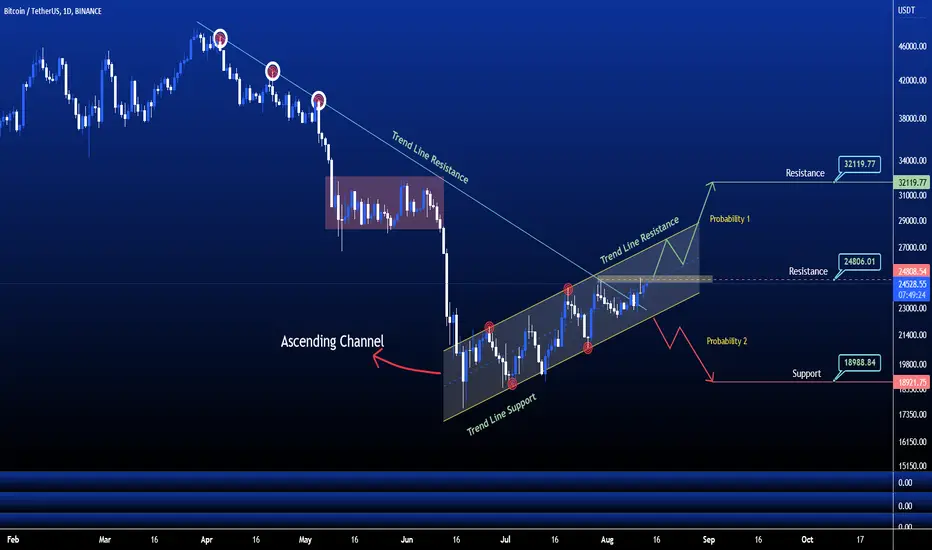
The above chart of Bitcoin laid out an ascending channel pattern. Ascending channel also known as the rising channel. The upper and lower trend lines that connect the higher highs and higher lows respectively appear to move within a rising slope. This pattern is generally a characteristic of a bullish trend.
Currently, Bitcoin (BTC) is in the range of $24515. If the pattern continues, the price of BTC might reach the resistance levels of $32119.If the trend reverses, then the price of BTC may fall to $18988
Comment your direction Probability 1 or Probability 2 ?
Currently, Bitcoin (BTC) is in the range of $24515. If the pattern continues, the price of BTC might reach the resistance levels of $32119.If the trend reverses, then the price of BTC may fall to $18988
Comment your direction Probability 1 or Probability 2 ?
Nota
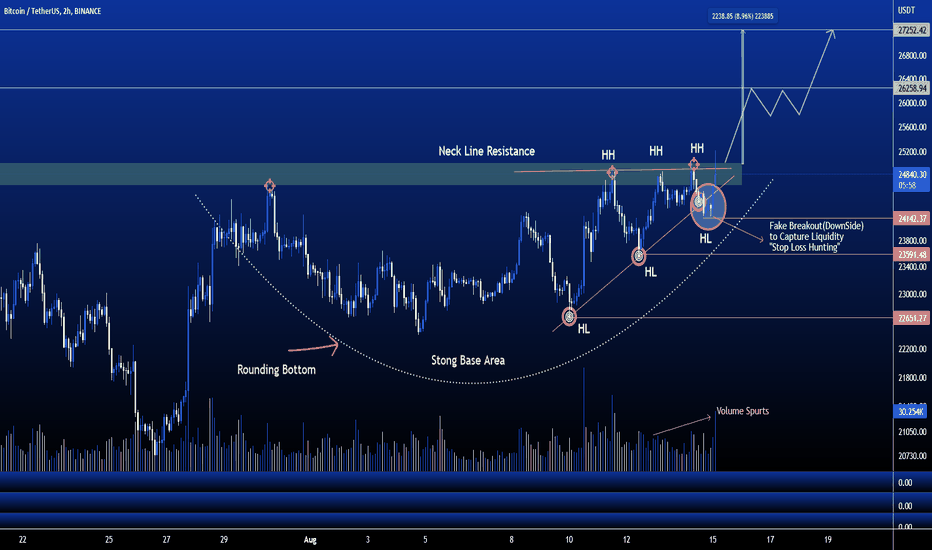
Nota

Publicaciones relacionadas
Exención de responsabilidad
La información y las publicaciones no constituyen, ni deben considerarse como, asesoramiento o recomendaciones financieras, de inversión, de trading u otro tipo, proporcionadas o respaldadas por TradingView. Obtenga más información en Condiciones de uso.
Publicaciones relacionadas
Exención de responsabilidad
La información y las publicaciones no constituyen, ni deben considerarse como, asesoramiento o recomendaciones financieras, de inversión, de trading u otro tipo, proporcionadas o respaldadas por TradingView. Obtenga más información en Condiciones de uso.