
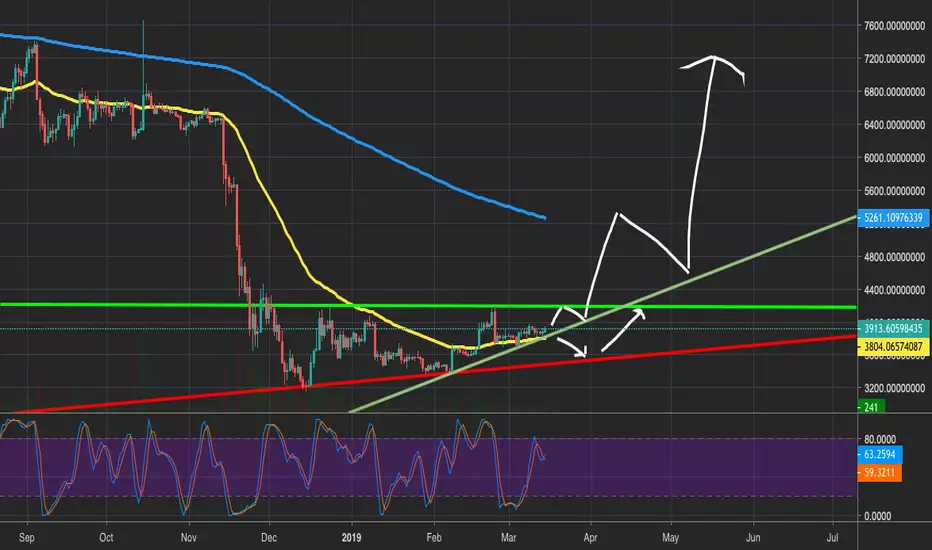
Yellow = 50 EMA
Blue = 300 EMA
After it break the vertical line at $4198. It wil most likely test the 300EMA which is the same as 50EMA on the weekly chart. On the weekly chart, the Stochastic RSI is getting to overbought levels, which is worrying, so we might see a correction soon. We have to wait and see what will happen.
Blue = 300 EMA
After it break the vertical line at $4198. It wil most likely test the 300EMA which is the same as 50EMA on the weekly chart. On the weekly chart, the Stochastic RSI is getting to overbought levels, which is worrying, so we might see a correction soon. We have to wait and see what will happen.

Exención de responsabilidad
La información y las publicaciones no constituyen, ni deben considerarse como, asesoramiento o recomendaciones financieras, de inversión, de trading u otro tipo, proporcionadas o respaldadas por TradingView. Obtenga más información en Condiciones de uso.
Exención de responsabilidad
La información y las publicaciones no constituyen, ni deben considerarse como, asesoramiento o recomendaciones financieras, de inversión, de trading u otro tipo, proporcionadas o respaldadas por TradingView. Obtenga más información en Condiciones de uso.