
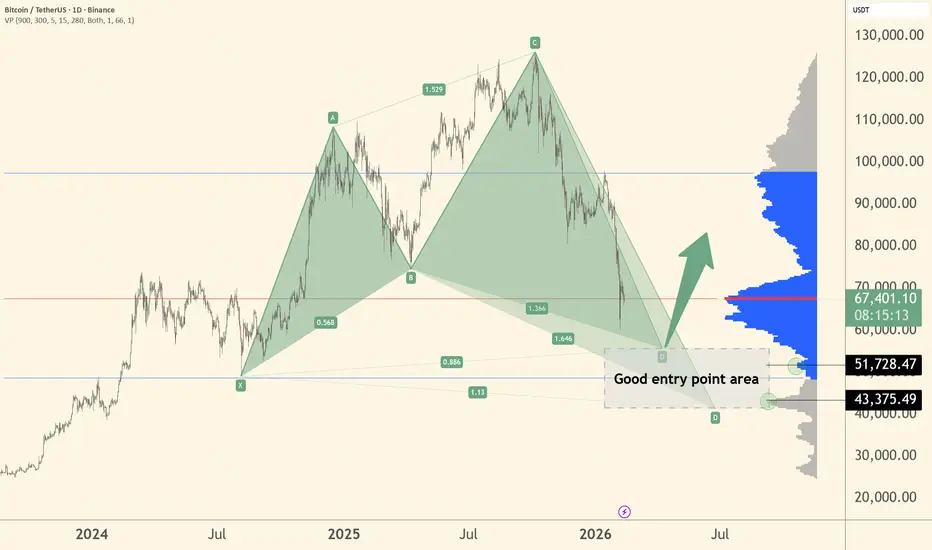
This is a BTC daily chart showing a Shark harmonic pattern forming.
Price moved in a large 5-point structure labeled X → A → B → C → D.
We are now approaching point D, which is the potential reversal zone. That zone is defined between the 0,886 and 1,13 Fib ratios.
The highlighted grey box (around $43k–$52k) is marked as a “good entry point area”.
This is where the pattern suggests BTC could find support and potentially reverse upward.
On the right side, the blue/grey volume profile shows strong historical trading activity in this zone — which adds confluence. My targets would be at aprox. 51800 and 43400.
TL;DR:
BTC is correcting into a strong support + harmonic completion zone, where a bounce could happen.
Price moved in a large 5-point structure labeled X → A → B → C → D.
We are now approaching point D, which is the potential reversal zone. That zone is defined between the 0,886 and 1,13 Fib ratios.
The highlighted grey box (around $43k–$52k) is marked as a “good entry point area”.
This is where the pattern suggests BTC could find support and potentially reverse upward.
On the right side, the blue/grey volume profile shows strong historical trading activity in this zone — which adds confluence. My targets would be at aprox. 51800 and 43400.
TL;DR:
BTC is correcting into a strong support + harmonic completion zone, where a bounce could happen.

Exención de responsabilidad
La información y las publicaciones no constituyen, ni deben considerarse como, asesoramiento o recomendaciones financieras, de inversión, de trading u otro tipo, proporcionadas o respaldadas por TradingView. Obtenga más información en Condiciones de uso.
Exención de responsabilidad
La información y las publicaciones no constituyen, ni deben considerarse como, asesoramiento o recomendaciones financieras, de inversión, de trading u otro tipo, proporcionadas o respaldadas por TradingView. Obtenga más información en Condiciones de uso.