
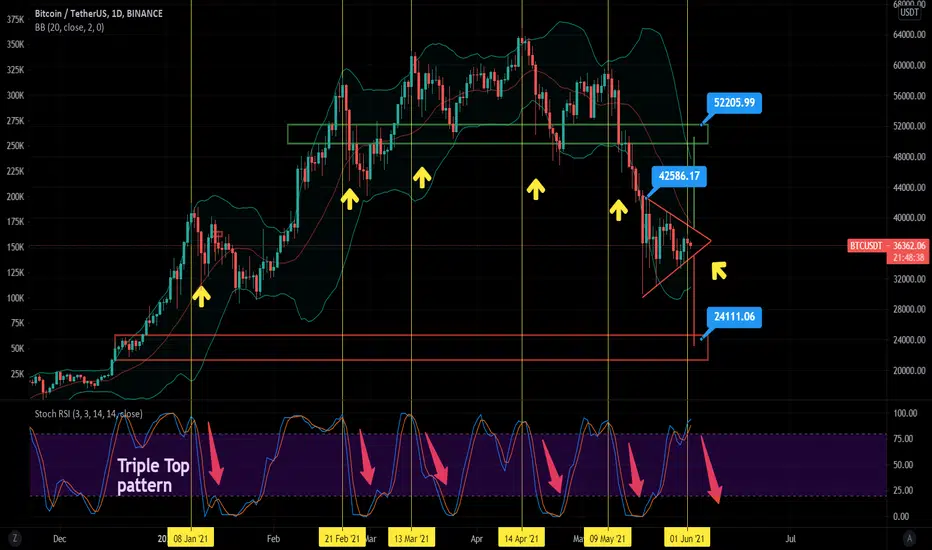
Based on BTC daily chart, it is currently still consolidating in the apex triangle . A breakout to the downside will bring us to a price target of around $24k. Otherwise, breaking to the upside will bring BTC to a price target of around $52k which is unlikely.
Bollinger Band showing a squeeze which indicates a sharp move will come soon.
Stochastic RSI is following my previous prediction where it had a final upward move before heading down. This indicates BTC will have a further correction unless BTC forms a sharp upward move and breaks $42k which will gives a Triple Top Structure in Stochastic RSI pattern(highly unlikely).
Bollinger Band showing a squeeze which indicates a sharp move will come soon.
Stochastic RSI is following my previous prediction where it had a final upward move before heading down. This indicates BTC will have a further correction unless BTC forms a sharp upward move and breaks $42k which will gives a Triple Top Structure in Stochastic RSI pattern(highly unlikely).

Publicaciones relacionadas
Exención de responsabilidad
La información y las publicaciones no constituyen, ni deben considerarse como, asesoramiento o recomendaciones financieras, de inversión, de trading u otro tipo, proporcionadas o respaldadas por TradingView. Obtenga más información en Condiciones de uso.
Publicaciones relacionadas
Exención de responsabilidad
La información y las publicaciones no constituyen, ni deben considerarse como, asesoramiento o recomendaciones financieras, de inversión, de trading u otro tipo, proporcionadas o respaldadas por TradingView. Obtenga más información en Condiciones de uso.