
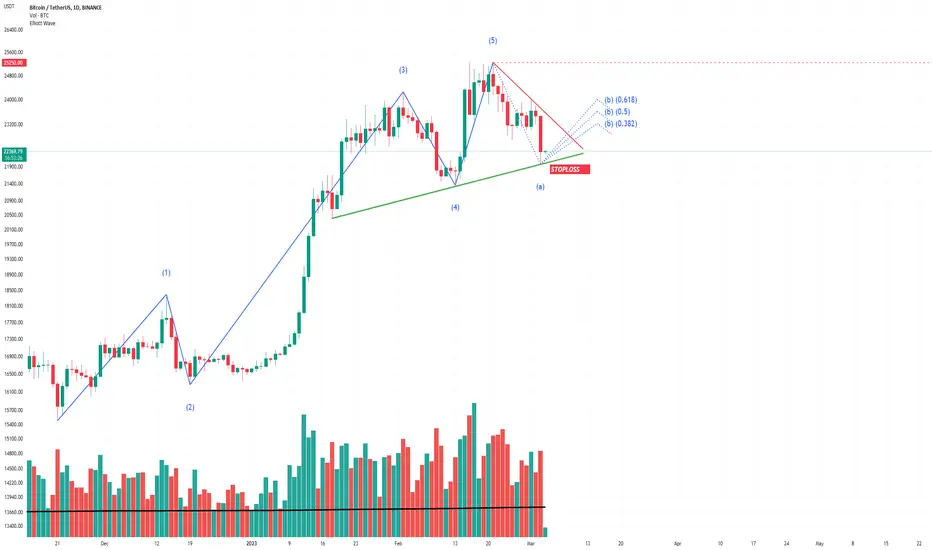
As you can see the main trend lines are on the chart.
The Trading View's Elliot Wave projection suggests going around the next resistance IF the current correction is over and if not, the stop loss will be triggered based on the support's break.
Since we are near a good support of the main up trend, there is a good risk to reward Ratio for going long.
Green trend line is the stop loss, any price action passing it is a red flag.
Red trend line can be used as the take profit.
The Trading View's Elliot Wave projection suggests going around the next resistance IF the current correction is over and if not, the stop loss will be triggered based on the support's break.
Since we are near a good support of the main up trend, there is a good risk to reward Ratio for going long.
Green trend line is the stop loss, any price action passing it is a red flag.
Red trend line can be used as the take profit.
Operación cerrada: precio stop alcanzado
Bulls are trying hard but bears have the upper hand and DXY is helping them so far.
Publicaciones relacionadas
Exención de responsabilidad
La información y las publicaciones no constituyen, ni deben considerarse como, asesoramiento o recomendaciones financieras, de inversión, de trading u otro tipo, proporcionadas o respaldadas por TradingView. Obtenga más información en Condiciones de uso.
Publicaciones relacionadas
Exención de responsabilidad
La información y las publicaciones no constituyen, ni deben considerarse como, asesoramiento o recomendaciones financieras, de inversión, de trading u otro tipo, proporcionadas o respaldadas por TradingView. Obtenga más información en Condiciones de uso.