
Evening Traders,
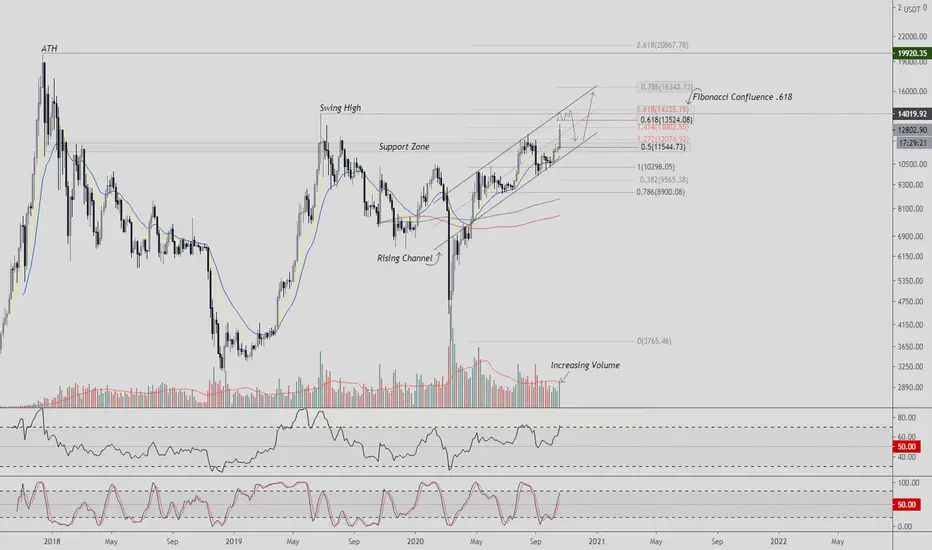
Today’s analysis – BTCUSDT = impressive rise, running into key Fibonacci levels where a short term rejection is probable.
Points to consider,
- Price Action Impulsive
- Rising Channel Resistance (.618 Fib Confluence)
- Support Zone Confluence (.50 Fib Confluence)
- Oscillators Bullish Control Zone
- Volume Increasing
BTCUSDT’s immediate price action is impulsive breaking from its support zone. This allows us to have a bullish bias on the market.
Price is approaching channel resistance that has heavy confluence with the .618 Fibonacci Extensions and Retracement, an initial rejection here is plausible.
BTCUSDT has flipped resistance into clear support that is also in confluence with the .50 Fibonacci level. A back test here is plausible and must hold for a bullish market structure.
Both oscillators are overextending, further upside momentum is highly probable until reaching officially overbought conditions.
The volume profile is increasing, this is a sign of a true breakout and any pullback is likely to be bought up.
Overall, in my opinion, BTCUSDT is a valid long at support zone; price action is to be used upone discretion/ management of trade.
Hope this analysis helps!
Thank you for following my work
And remember,
“You create your own game in your mind based on your beliefs, intents, perception and rules.”
― Mark Douglas
Today’s analysis – BTCUSDT = impressive rise, running into key Fibonacci levels where a short term rejection is probable.
Points to consider,
- Price Action Impulsive
- Rising Channel Resistance (.618 Fib Confluence)
- Support Zone Confluence (.50 Fib Confluence)
- Oscillators Bullish Control Zone
- Volume Increasing
BTCUSDT’s immediate price action is impulsive breaking from its support zone. This allows us to have a bullish bias on the market.
Price is approaching channel resistance that has heavy confluence with the .618 Fibonacci Extensions and Retracement, an initial rejection here is plausible.
BTCUSDT has flipped resistance into clear support that is also in confluence with the .50 Fibonacci level. A back test here is plausible and must hold for a bullish market structure.
Both oscillators are overextending, further upside momentum is highly probable until reaching officially overbought conditions.
The volume profile is increasing, this is a sign of a true breakout and any pullback is likely to be bought up.
Overall, in my opinion, BTCUSDT is a valid long at support zone; price action is to be used upone discretion/ management of trade.
Hope this analysis helps!
Thank you for following my work
And remember,
“You create your own game in your mind based on your beliefs, intents, perception and rules.”
― Mark Douglas

Join the Free Trading Group
Telegram: t.me/freetradingden 🔥
Claim $1000 Deposit Bonus 🎁
Trade with perks & support the community!
partner.blofin.com/d/TheAlchemist
Stay sharp, trade smart.
— Team The Alchemist ⚔️
Telegram: t.me/freetradingden 🔥
Claim $1000 Deposit Bonus 🎁
Trade with perks & support the community!
partner.blofin.com/d/TheAlchemist
Stay sharp, trade smart.
— Team The Alchemist ⚔️
Exención de responsabilidad
La información y las publicaciones no constituyen, ni deben considerarse como, asesoramiento o recomendaciones financieras, de inversión, de trading u otro tipo, proporcionadas o respaldadas por TradingView. Obtenga más información en Condiciones de uso.
Join the Free Trading Group
Telegram: t.me/freetradingden 🔥
Claim $1000 Deposit Bonus 🎁
Trade with perks & support the community!
partner.blofin.com/d/TheAlchemist
Stay sharp, trade smart.
— Team The Alchemist ⚔️
Telegram: t.me/freetradingden 🔥
Claim $1000 Deposit Bonus 🎁
Trade with perks & support the community!
partner.blofin.com/d/TheAlchemist
Stay sharp, trade smart.
— Team The Alchemist ⚔️
Exención de responsabilidad
La información y las publicaciones no constituyen, ni deben considerarse como, asesoramiento o recomendaciones financieras, de inversión, de trading u otro tipo, proporcionadas o respaldadas por TradingView. Obtenga más información en Condiciones de uso.