
Hi Guys 👋
Lets look at the Bitcoin Chart 👀
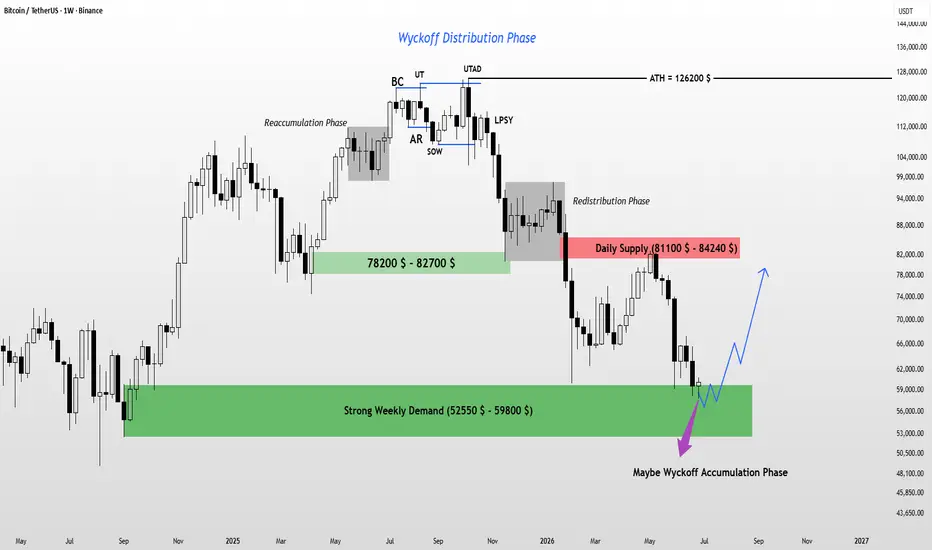
📌By closely analyzing Bitcoin’s weekly chart, we can clearly identify a Wyckoff distribution structure forming at the all-time high, followed by a relatively strong bearish trend.
During this decline, a redistribution phase has also taken place, reinforcing the continuation of the downward move.
📌In February 2026, the price approached the weekly demand zone but reacted before making direct contact, leading to a bullish leg. However, this upward movement was rejected above the $80,000 level, and the market recently formed a new low around $57,900.
📌It is expected that the marked demand zone will be able to hold the price and potentially act as a valid bottom for this market cycle.
⚠️ All published content reflects the analyst’s opinion only and does not constitute any financial or investment advice.
Feel Free to share your thought and comments on this post 😊
Sincerely,
Hossein Poursaei
Lets look at the Bitcoin Chart 👀
📌By closely analyzing Bitcoin’s weekly chart, we can clearly identify a Wyckoff distribution structure forming at the all-time high, followed by a relatively strong bearish trend.
During this decline, a redistribution phase has also taken place, reinforcing the continuation of the downward move.
📌In February 2026, the price approached the weekly demand zone but reacted before making direct contact, leading to a bullish leg. However, this upward movement was rejected above the $80,000 level, and the market recently formed a new low around $57,900.
📌It is expected that the marked demand zone will be able to hold the price and potentially act as a valid bottom for this market cycle.
⚠️ All published content reflects the analyst’s opinion only and does not constitute any financial or investment advice.
Feel Free to share your thought and comments on this post 😊
Sincerely,
Hossein Poursaei

Exención de responsabilidad
La información y las publicaciones no constituyen, ni deben considerarse como, asesoramiento o recomendaciones financieras, de inversión, de trading u otro tipo, proporcionadas o respaldadas por TradingView. Obtenga más información en Condiciones de uso.
Exención de responsabilidad
La información y las publicaciones no constituyen, ni deben considerarse como, asesoramiento o recomendaciones financieras, de inversión, de trading u otro tipo, proporcionadas o respaldadas por TradingView. Obtenga más información en Condiciones de uso.