
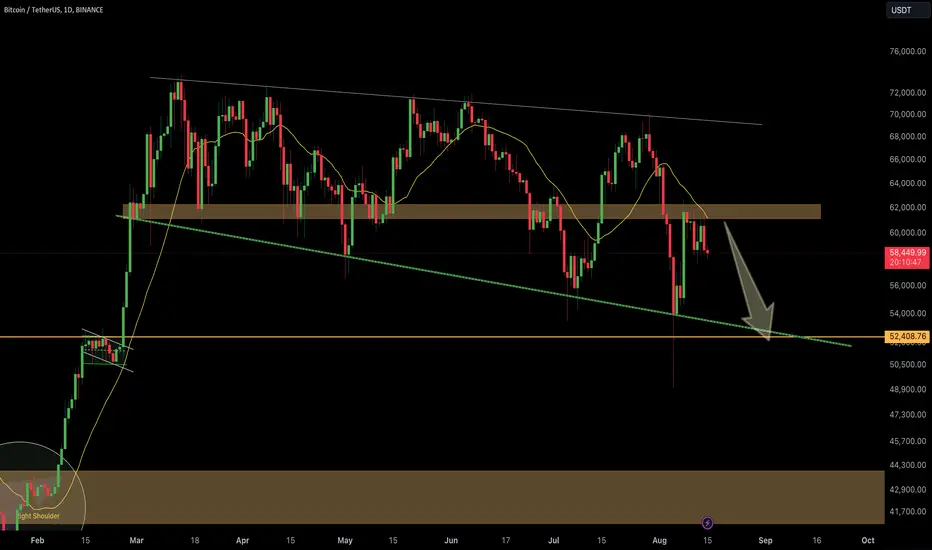
BTC/USDT continues to trade near the 58,409 USDT level, which is a crucial support area. The price is hovering near the bottom of a descending triangle, indicating that this support level is being tested. The green trendline and the 52,408.76 USDT support remain critical levels to watch. A breakdown below this level could lead to further downside momentum, potentially taking BTC towards lower support levels.
On the resistance side, BTC is struggling to reclaim the 60,000 USDT level, and until it breaks above, the bearish trend could continue.
Feel free to ask if you need further details or additional analysis!
Remember: This is not financial advice. Stay tuned to us for further updates and analysis. Thank you!
On the resistance side, BTC is struggling to reclaim the 60,000 USDT level, and until it breaks above, the bearish trend could continue.
Feel free to ask if you need further details or additional analysis!
Remember: This is not financial advice. Stay tuned to us for further updates and analysis. Thank you!

Publicaciones relacionadas
Exención de responsabilidad
La información y las publicaciones no constituyen, ni deben considerarse como, asesoramiento o recomendaciones financieras, de inversión, de trading u otro tipo, proporcionadas o respaldadas por TradingView. Obtenga más información en Condiciones de uso.
Publicaciones relacionadas
Exención de responsabilidad
La información y las publicaciones no constituyen, ni deben considerarse como, asesoramiento o recomendaciones financieras, de inversión, de trading u otro tipo, proporcionadas o respaldadas por TradingView. Obtenga más información en Condiciones de uso.