
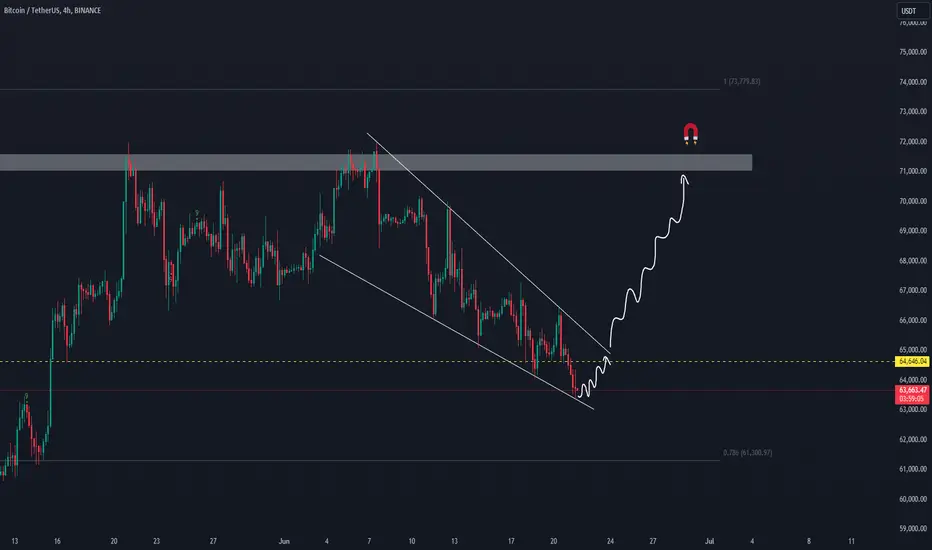
Analyzing the 4-hour Bitcoin chart, we can observe a descending wedge pattern forming. Currently, the price has reached the support line of this formation. If it bounces off this support and breaks through the resistance line, it will confirm the upward momentum. These patterns typically indicate a bullish reversal, leading to a potential rise. Target: Bitcoin (BTC) Target: $71,000, expected to be reached within a week. Let's keep an eye on this pattern for a breakout to confirm the bullish scenario!

Exención de responsabilidad
La información y las publicaciones no constituyen, ni deben considerarse como, asesoramiento o recomendaciones financieras, de inversión, de trading u otro tipo, proporcionadas o respaldadas por TradingView. Obtenga más información en Condiciones de uso.
Exención de responsabilidad
La información y las publicaciones no constituyen, ni deben considerarse como, asesoramiento o recomendaciones financieras, de inversión, de trading u otro tipo, proporcionadas o respaldadas por TradingView. Obtenga más información en Condiciones de uso.