
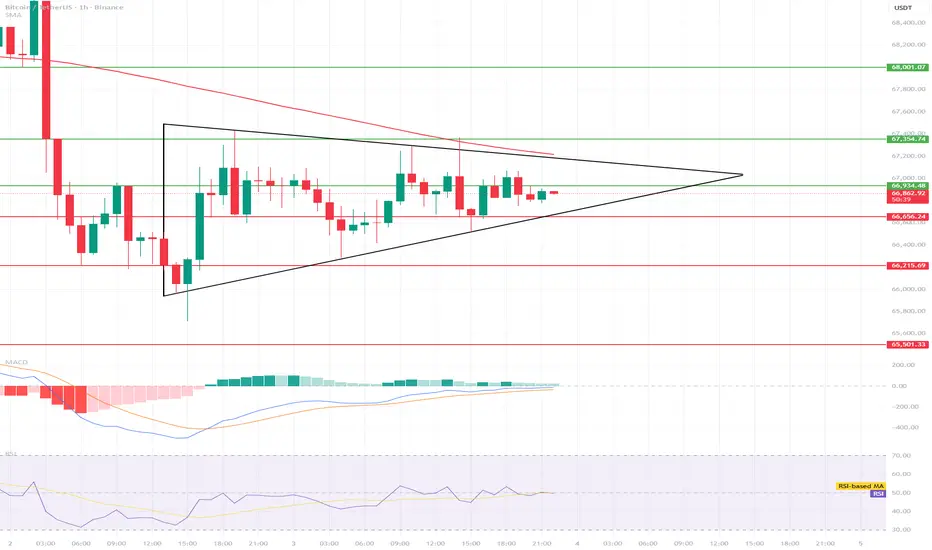
🔍 What I see on the chart
1. Structure
Lower highs (falling resistance line)
Higher lows (rising support line)
➡️ Classic triangle squeeze
Price now:
👉 ~66.8k → near the middle of the formation (i.e., no advantage)
📊 Key levels
🟢 Resistance:
66.9k – 67k (local resistance)
67.35k (strong level)
68k+ (HTF resistance)
🔴 Support:
66.65k
66.2k
65.5k (if the breakdown is strong)
⚙️ Indicators
MACD
Momentum is rising but weakening
Histogram is decreasing → no strength for a breakout (yet)
RSI
~50 → neutral
➡️ Perfect for a breakout, but the direction isn't yet Selected
🔥 Scenarios
🟢 LONG SCENARIO (slightly more likely)
Condition:
Breakout > 67k + candle close
Targets:
67.35k
68k
68.8k (if momentum increases)
👉 This would be an upward breakout of the triangle.
🔴 SHORT SCENARIO
Condition:
Breakout < 66.6k
Targets:
66.2k
65.5k
even 64.8k (if panic)
1. Structure
Lower highs (falling resistance line)
Higher lows (rising support line)
➡️ Classic triangle squeeze
Price now:
👉 ~66.8k → near the middle of the formation (i.e., no advantage)
📊 Key levels
🟢 Resistance:
66.9k – 67k (local resistance)
67.35k (strong level)
68k+ (HTF resistance)
🔴 Support:
66.65k
66.2k
65.5k (if the breakdown is strong)
⚙️ Indicators
MACD
Momentum is rising but weakening
Histogram is decreasing → no strength for a breakout (yet)
RSI
~50 → neutral
➡️ Perfect for a breakout, but the direction isn't yet Selected
🔥 Scenarios
🟢 LONG SCENARIO (slightly more likely)
Condition:
Breakout > 67k + candle close
Targets:
67.35k
68k
68.8k (if momentum increases)
👉 This would be an upward breakout of the triangle.
🔴 SHORT SCENARIO
Condition:
Breakout < 66.6k
Targets:
66.2k
65.5k
even 64.8k (if panic)

Exención de responsabilidad
La información y las publicaciones no constituyen, ni deben considerarse como, asesoramiento o recomendaciones financieras, de inversión, de trading u otro tipo, proporcionadas o respaldadas por TradingView. Obtenga más información en Condiciones de uso.
Exención de responsabilidad
La información y las publicaciones no constituyen, ni deben considerarse como, asesoramiento o recomendaciones financieras, de inversión, de trading u otro tipo, proporcionadas o respaldadas por TradingView. Obtenga más información en Condiciones de uso.