
👋 Welcome to TradeCityPro!
Let’s move on to Bitcoin analysis. Today, the market is dealing with a very important resistance zone.
⌛️ 4-Hour Timeframe
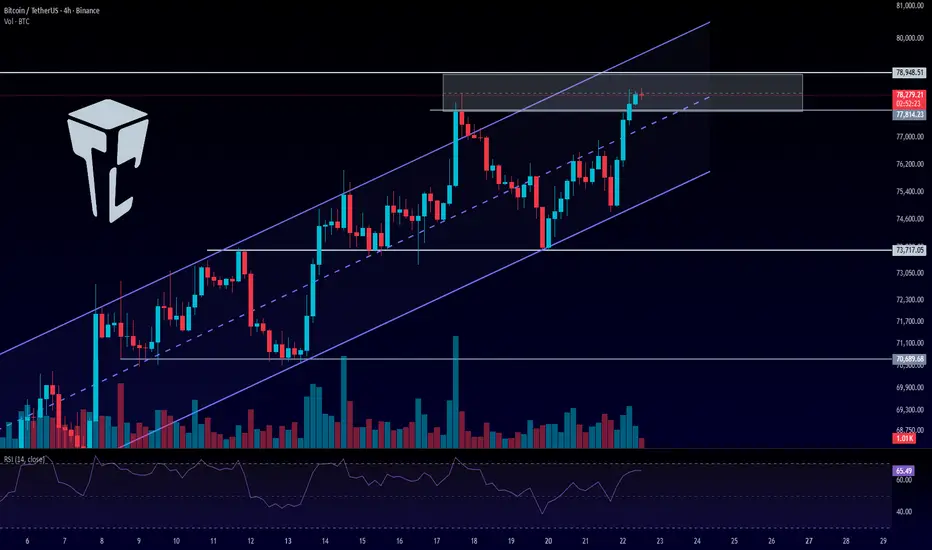
On the 4-hour chart, Bitcoin is moving inside an ascending channel. It has already made one fake breakout to the upside, and now, after finding support at the bottom of the channel, price has reached its resistance area.
✔️ This resistance zone lies between 77,814 and 78,948. A breakout of this range would be a strong trigger for opening a long position.
🔔 For now, the move toward this area has been accompanied by weak momentum, with smaller candle sizes.
💥 This indicates trend weakness, which lowers the probability of a breakout.
📊 However, if buying volume continues to increase, price could still break this zone. In that case, we can look for a long position on the breakout.
✨ If price gets rejected from this area, a bearish move could begin. In that scenario, with a break below the channel and activation of the 73,717 trigger, we can look for a short position.
❌ Disclaimer ❌
Trading futures is highly risky and dangerous. If you're not an expert, these triggers may not be suitable for you. You should first learn risk and capital management. You can also use the educational content from this channel.
Finally, these triggers reflect my personal opinions on price action, and the market may move completely against this analysis. So, do your own research before opening any position.

💥 Don’t Miss Out!
🏆 Trade & Earn : bitunix.com/register?vipCode=TCPINT
💰 Join the Telegram Channel Now: t.me/Tradecityproint
🤵 Business Contact: Tradecityproteam@gmail.com
🏆 Trade & Earn : bitunix.com/register?vipCode=TCPINT
💰 Join the Telegram Channel Now: t.me/Tradecityproint
🤵 Business Contact: Tradecityproteam@gmail.com
Publicaciones relacionadas
Exención de responsabilidad
La información y las publicaciones no constituyen, ni deben considerarse como, asesoramiento o recomendaciones financieras, de inversión, de trading u otro tipo, proporcionadas o respaldadas por TradingView. Obtenga más información en Condiciones de uso.