
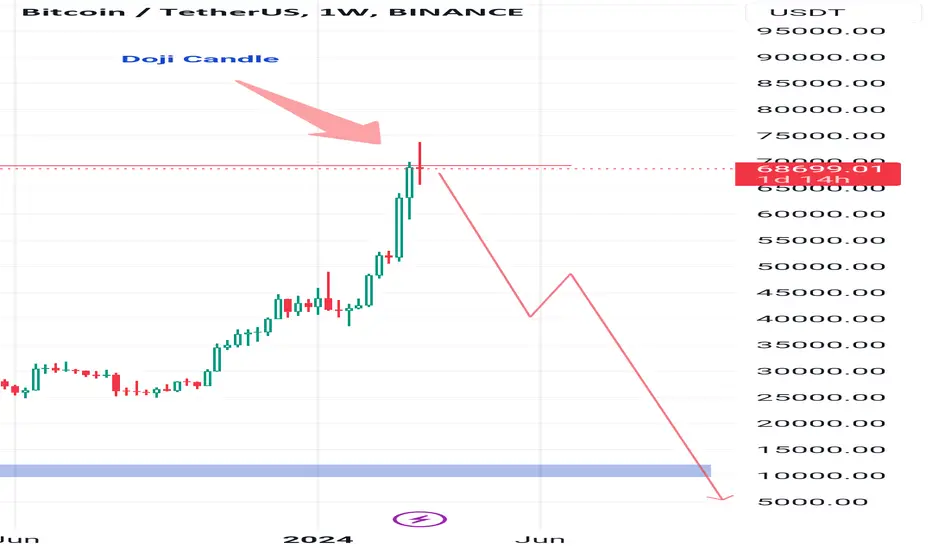
Supply Zone:
A supply zone occurs when the supply of a cryptocurrency exceeds the demand.
In this area, there is excess supply, leading to a falling price.
On a price chart, a supply zone is associated with a downtrend.
Traders often place sell orders in supply zones, expecting prices to decline further.
Imp : forming doji candles in weekly chart
Interpreting Doji Patterns:
Bearish Doji: When a Doji forms at a resistance area, it can signal indecision or a potential trend reversal.
However, the context matters:
If the preceding trend is upward, a bearish Doji may indicate a reversal.
If the preceding trend is downward, it could reinforce the existing bearish sentiment.
A supply zone occurs when the supply of a cryptocurrency exceeds the demand.
In this area, there is excess supply, leading to a falling price.
On a price chart, a supply zone is associated with a downtrend.
Traders often place sell orders in supply zones, expecting prices to decline further.
Imp : forming doji candles in weekly chart
Interpreting Doji Patterns:
Bearish Doji: When a Doji forms at a resistance area, it can signal indecision or a potential trend reversal.
However, the context matters:
If the preceding trend is upward, a bearish Doji may indicate a reversal.
If the preceding trend is downward, it could reinforce the existing bearish sentiment.

Exención de responsabilidad
La información y las publicaciones no constituyen, ni deben considerarse como, asesoramiento o recomendaciones financieras, de inversión, de trading u otro tipo, proporcionadas o respaldadas por TradingView. Obtenga más información en Condiciones de uso.
Exención de responsabilidad
La información y las publicaciones no constituyen, ni deben considerarse como, asesoramiento o recomendaciones financieras, de inversión, de trading u otro tipo, proporcionadas o respaldadas por TradingView. Obtenga más información en Condiciones de uso.