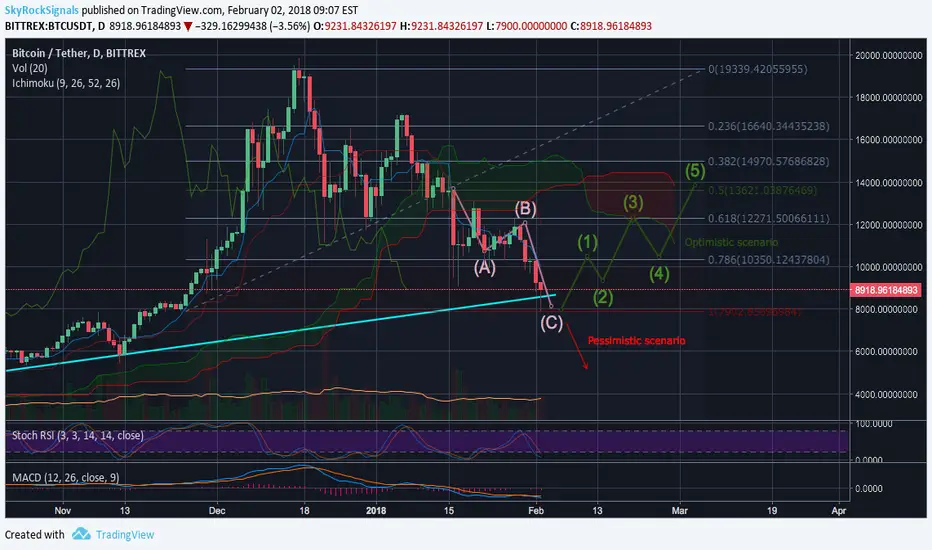
On the 1 day timeframe chart we can see that BTC is in a critical stage. The price touched Fib 1 support level and bounced back, now it is above the trend line again. MACD and RSI both indicate further growth, nevertheless indicator analysis never predicted BTC price movement. Whales understand that if the price goes below the trend line it will break support level and will go much lower. It is not in their interests so they should help it to consolidate and to go to the previous levels. Two possible scenarios are drawn on the chart. Which scenario is more likely to happen we will see in the end of this day. If trades close higher that it opened today then the optimistic scenario should take place otherwise we will see a greater correction wave.

Exención de responsabilidad
La información y las publicaciones no constituyen, ni deben considerarse como, asesoramiento o recomendaciones financieras, de inversión, de trading u otro tipo, proporcionadas o respaldadas por TradingView. Obtenga más información en Condiciones de uso.
Exención de responsabilidad
La información y las publicaciones no constituyen, ni deben considerarse como, asesoramiento o recomendaciones financieras, de inversión, de trading u otro tipo, proporcionadas o respaldadas por TradingView. Obtenga más información en Condiciones de uso.