Largo
BitShares BTSBTC - Long Setup D1
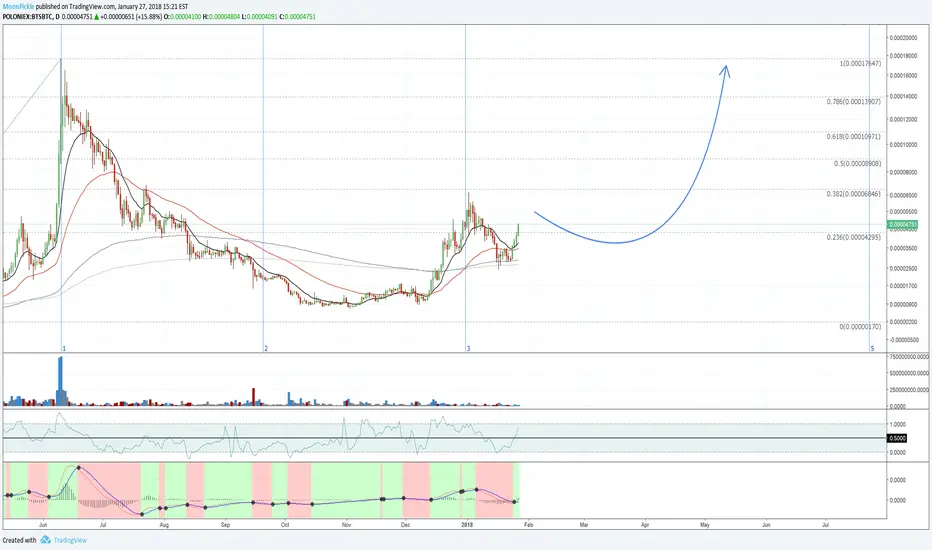
Use fib lines as targets - both time and price analysis are available on the chart.
Measure fib zone 1 to fib zone 2 to determine a time estimate for the formation on the right side of the cup chart pattern within fib zone 3 to fib zone 5.
RSI shows plenty of action on the upper +50 range, indicating bullish bias.
MACD shows fresh momentum.
No volume divergence.
Double bottom pattern shows minor correction is done.
EMA bounce up, no cross.
READY TO GO.
Measure fib zone 1 to fib zone 2 to determine a time estimate for the formation on the right side of the cup chart pattern within fib zone 3 to fib zone 5.
RSI shows plenty of action on the upper +50 range, indicating bullish bias.
MACD shows fresh momentum.
No volume divergence.
Double bottom pattern shows minor correction is done.
EMA bounce up, no cross.
READY TO GO.
Operación activa
Nota
buy the break out, when price action leaves/breaks the downward channel (moving up)Nota
leaving the buy boxNota
BOOMNota
fractals on 4HNota
btc correction took bts with it, a double bottom has appeared on 4HOrden cancelada
btc
Exención de responsabilidad
La información y las publicaciones no constituyen, ni deben considerarse como, asesoramiento o recomendaciones financieras, de inversión, de trading u otro tipo, proporcionadas o respaldadas por TradingView. Obtenga más información en Condiciones de uso.
Exención de responsabilidad
La información y las publicaciones no constituyen, ni deben considerarse como, asesoramiento o recomendaciones financieras, de inversión, de trading u otro tipo, proporcionadas o respaldadas por TradingView. Obtenga más información en Condiciones de uso.