
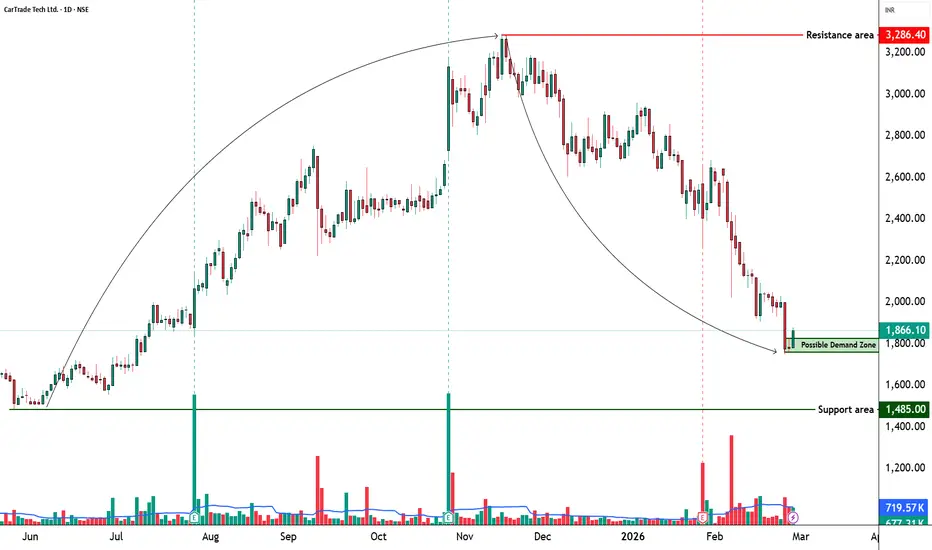
📊 CARTRADE – STWP Equity Snapshot
Ticker: NSE: CARTRADE
Sector: 🚗 Digital Auto Platform / Marketplace
CMP: 1,866.10 ▲ (+4.85% | 26 Feb 2026)
Learning Rating: ⭐⭐⭐☆☆ (Relief Bounce Within Broader Downtrend)
Chart Pattern Observed: 📉 Extended Markdown into Possible Demand Reaction
Candlestick Context: Strong Bullish Reversal Candle from Oversold Zone
📊 Technical Snapshot
CARTRADE has been in a sustained downtrend following distribution near the 3,000 zone, forming a clear sequence of lower highs and lower lows. The recent price action reflects a sharp reaction from the 1,750–1,820 band, where demand absorption appears to be attempting stabilization.
The latest bullish candle indicates responsive buying from a possible demand zone rather than confirmed structural reversal. RSI is positioned near 32.76, reflecting recovery from oversold territory — supportive of short-term bounce potential but not yet signalling broader trend reversal.
Momentum indicators suggest short-term relief strength, but the larger structure remains below prior breakdown levels. From a CPR perspective, price remains below key higher timeframe resistance bands, and continuation requires sustained acceptance above immediate supply clusters.
Structurally, this is currently a range-building attempt within a broader downtrend context. Until price reclaims and sustains above the 1,938–1,998 resistance zone, the recovery remains tactical rather than structural.
📊 Volume Analysis
🔹 Current Volume: Above recent average
🔹 Relative Volume (Vol X): 1.26
💡 Interpretation:
The bounce is supported by above-average participation, suggesting genuine buying response from lower levels. However, continuation strength must be validated by follow-through volume near resistance zones.
🔑 Key Levels – Daily Timeframe
Support Areas: 1,806 | 1,746 | 1,710
Resistance Areas: 1,938 | 1,998 | 2,156
These are zones where price has previously paused, reacted, or reversed.
🔍 Structure Read – What Matters Now
What’s Catching Our Eye:
Sharp rebound from structural demand after extended markdown phase.
What to Watch For:
Acceptance above 1,938–1,998 resistance band.
Failure Zone:
Sustained move below 1,746 support area.
Risks to Watch:
Relief rally failure and continuation of broader downtrend.
What to Expect Next:
Either short-term range expansion toward resistance or consolidation within developing base.
📌 Price Reference Framework – Educational View
🔹 Intraday Reference (Short-Term Observation)
Observation Zone: Around 1,878
Risk Invalidation Area: Below 1,776
Upside Reference Zones: 1,980 → 2,082
Used only to study short-term price behaviour and participation.
🔹 Swing Reference (Positional | 2–5 Sessions)
Observation Zone: Around 1,878
Risk Invalidation Area: Below 1,739
Upside Reference Zones: 2,156 → 2,364
Relevant only if price sustains above reclaimed support and shows continuation acceptance.
🧠 STWP View
Momentum: Moderate
Trend: Range within Broader Downtrend
Risk: High
Volume: Moderate
Sentiment: Neutral
RSI: 32.76 (Recovering from Oversold)
% Change: 4.85%
AI Score: 65/100 | Strength: 3.3/5
📘 Learning Note
Rebounds from oversold zones can be powerful — but structure shifts only when supply is reclaimed with acceptance. Study how price behaves near resistance, not just how it reacts from support.
⚠️ Disclaimer
This post is intended solely for educational and informational purposes. It does not constitute investment advice, a recommendation, or a solicitation to buy or sell any security. Market investments are subject to risk. Please consult a SEBI-registered financial advisor before making any investment decisions. STWP is not responsible for actions taken based on this analysis.
🚀 Stay Calm. Stay Clean. Trade With Patience.
Ticker: NSE: CARTRADE
Sector: 🚗 Digital Auto Platform / Marketplace
CMP: 1,866.10 ▲ (+4.85% | 26 Feb 2026)
Learning Rating: ⭐⭐⭐☆☆ (Relief Bounce Within Broader Downtrend)
Chart Pattern Observed: 📉 Extended Markdown into Possible Demand Reaction
Candlestick Context: Strong Bullish Reversal Candle from Oversold Zone
📊 Technical Snapshot
CARTRADE has been in a sustained downtrend following distribution near the 3,000 zone, forming a clear sequence of lower highs and lower lows. The recent price action reflects a sharp reaction from the 1,750–1,820 band, where demand absorption appears to be attempting stabilization.
The latest bullish candle indicates responsive buying from a possible demand zone rather than confirmed structural reversal. RSI is positioned near 32.76, reflecting recovery from oversold territory — supportive of short-term bounce potential but not yet signalling broader trend reversal.
Momentum indicators suggest short-term relief strength, but the larger structure remains below prior breakdown levels. From a CPR perspective, price remains below key higher timeframe resistance bands, and continuation requires sustained acceptance above immediate supply clusters.
Structurally, this is currently a range-building attempt within a broader downtrend context. Until price reclaims and sustains above the 1,938–1,998 resistance zone, the recovery remains tactical rather than structural.
📊 Volume Analysis
🔹 Current Volume: Above recent average
🔹 Relative Volume (Vol X): 1.26
💡 Interpretation:
The bounce is supported by above-average participation, suggesting genuine buying response from lower levels. However, continuation strength must be validated by follow-through volume near resistance zones.
🔑 Key Levels – Daily Timeframe
Support Areas: 1,806 | 1,746 | 1,710
Resistance Areas: 1,938 | 1,998 | 2,156
These are zones where price has previously paused, reacted, or reversed.
🔍 Structure Read – What Matters Now
What’s Catching Our Eye:
Sharp rebound from structural demand after extended markdown phase.
What to Watch For:
Acceptance above 1,938–1,998 resistance band.
Failure Zone:
Sustained move below 1,746 support area.
Risks to Watch:
Relief rally failure and continuation of broader downtrend.
What to Expect Next:
Either short-term range expansion toward resistance or consolidation within developing base.
📌 Price Reference Framework – Educational View
🔹 Intraday Reference (Short-Term Observation)
Observation Zone: Around 1,878
Risk Invalidation Area: Below 1,776
Upside Reference Zones: 1,980 → 2,082
Used only to study short-term price behaviour and participation.
🔹 Swing Reference (Positional | 2–5 Sessions)
Observation Zone: Around 1,878
Risk Invalidation Area: Below 1,739
Upside Reference Zones: 2,156 → 2,364
Relevant only if price sustains above reclaimed support and shows continuation acceptance.
🧠 STWP View
Momentum: Moderate
Trend: Range within Broader Downtrend
Risk: High
Volume: Moderate
Sentiment: Neutral
RSI: 32.76 (Recovering from Oversold)
% Change: 4.85%
AI Score: 65/100 | Strength: 3.3/5
📘 Learning Note
Rebounds from oversold zones can be powerful — but structure shifts only when supply is reclaimed with acceptance. Study how price behaves near resistance, not just how it reacts from support.
⚠️ Disclaimer
This post is intended solely for educational and informational purposes. It does not constitute investment advice, a recommendation, or a solicitation to buy or sell any security. Market investments are subject to risk. Please consult a SEBI-registered financial advisor before making any investment decisions. STWP is not responsible for actions taken based on this analysis.
🚀 Stay Calm. Stay Clean. Trade With Patience.

STWP | Mentor & Demand-Supply Specialist |
Empowering traders through structured learning |
simpletradewithpatience.com
Community: chat.whatsapp.com/BEYz0tkqP0fJPBCWf59uel
wa.me/message/6IOPHGOXMGZ4N1
Educational Only
Empowering traders through structured learning |
simpletradewithpatience.com
Community: chat.whatsapp.com/BEYz0tkqP0fJPBCWf59uel
wa.me/message/6IOPHGOXMGZ4N1
Educational Only
Exención de responsabilidad
La información y las publicaciones no constituyen, ni deben considerarse como, asesoramiento o recomendaciones financieras, de inversión, de trading u otro tipo, proporcionadas o respaldadas por TradingView. Obtenga más información en Condiciones de uso.
STWP | Mentor & Demand-Supply Specialist |
Empowering traders through structured learning |
simpletradewithpatience.com
Community: chat.whatsapp.com/BEYz0tkqP0fJPBCWf59uel
wa.me/message/6IOPHGOXMGZ4N1
Educational Only
Empowering traders through structured learning |
simpletradewithpatience.com
Community: chat.whatsapp.com/BEYz0tkqP0fJPBCWf59uel
wa.me/message/6IOPHGOXMGZ4N1
Educational Only
Exención de responsabilidad
La información y las publicaciones no constituyen, ni deben considerarse como, asesoramiento o recomendaciones financieras, de inversión, de trading u otro tipo, proporcionadas o respaldadas por TradingView. Obtenga más información en Condiciones de uso.