
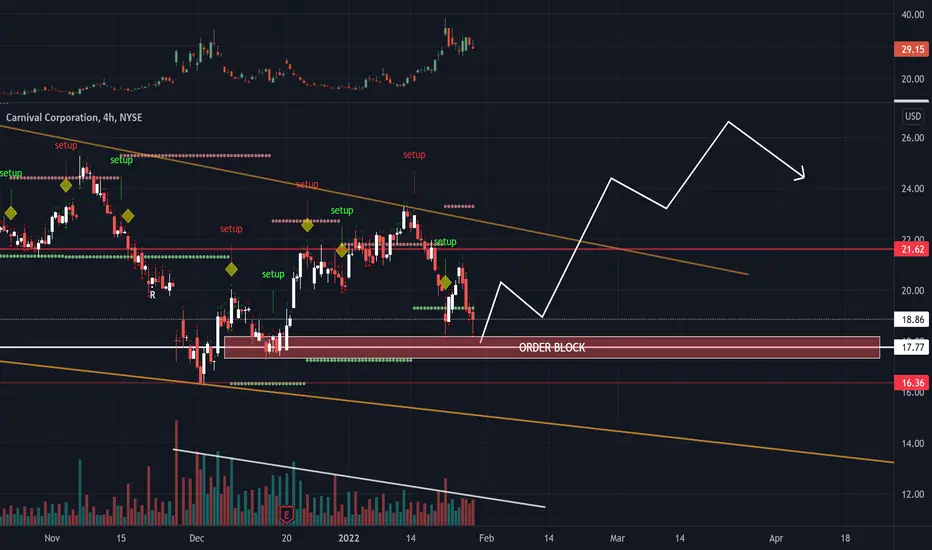
Just some basic technical analysis with the VIX chart at the top of the screen. As you may see, we are seeing a "double Bottom" which is a very bullish chart pattern. In conjunction with the VIX chart and the slowly decreasing Volume, it may be possible to see a reversal here on the next trading day. When we see more market participants buying then it would be safe to assume that there may be a possibility of market reversal.

Exención de responsabilidad
La información y las publicaciones no constituyen, ni deben considerarse como, asesoramiento o recomendaciones financieras, de inversión, de trading u otro tipo, proporcionadas o respaldadas por TradingView. Obtenga más información en Condiciones de uso.
Exención de responsabilidad
La información y las publicaciones no constituyen, ni deben considerarse como, asesoramiento o recomendaciones financieras, de inversión, de trading u otro tipo, proporcionadas o respaldadas por TradingView. Obtenga más información en Condiciones de uso.