
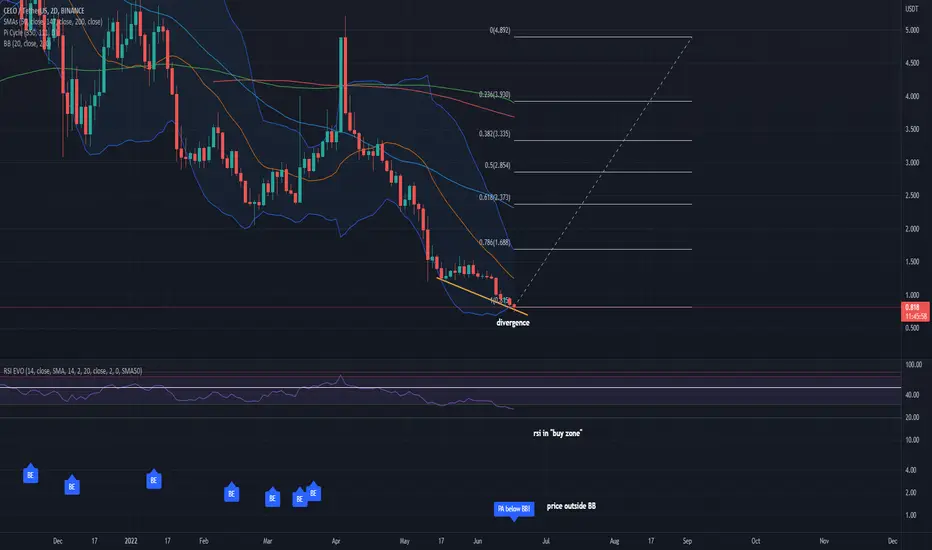
Consider the 2D USDT pair above:
1) RSI is in oversold, "buy zone"
2) Bullish divergence as drawn
3) Price and RSI breakout on 3D BTC pair

4) Dragonfly doji printed on 5D BTC pair after large downtrend, signifying trend reversal

Targets (initial): 1.5 - 1.6 - 2.3 USDT
Timeframe: Weeks (don't know exact number)
Leverage: 3-4x ( if we get a green candle close above the dragonfly's close in the 5D BTC pair chart, then chances of upside are even larger. Carefully manage risk. )
1) RSI is in oversold, "buy zone"
2) Bullish divergence as drawn
3) Price and RSI breakout on 3D BTC pair
4) Dragonfly doji printed on 5D BTC pair after large downtrend, signifying trend reversal
Targets (initial): 1.5 - 1.6 - 2.3 USDT
Timeframe: Weeks (don't know exact number)
Leverage: 3-4x ( if we get a green candle close above the dragonfly's close in the 5D BTC pair chart, then chances of upside are even larger. Carefully manage risk. )
Operación activa
Nota
BUY BUY BUY
Exención de responsabilidad
La información y las publicaciones no constituyen, ni deben considerarse como, asesoramiento o recomendaciones financieras, de inversión, de trading u otro tipo, proporcionadas o respaldadas por TradingView. Obtenga más información en Condiciones de uso.
Exención de responsabilidad
La información y las publicaciones no constituyen, ni deben considerarse como, asesoramiento o recomendaciones financieras, de inversión, de trading u otro tipo, proporcionadas o respaldadas por TradingView. Obtenga más información en Condiciones de uso.